3rd Quarter of FY March 2026 Performance Briefing (Speech Text)
First Nine Months, FY March 2026 Results Highlights

Tetsuji Yamanishi
Senior Executive Vice President & CFO
Hello, I am Tetsuji Yamanishi. Thank you for taking the time to attend TDK’s performance briefing for the third quarter on a YTD (year-to-date) basis of FY March 2026. I would like to explain the highlights of our consolidated results.
9M, FY March 2026 key points
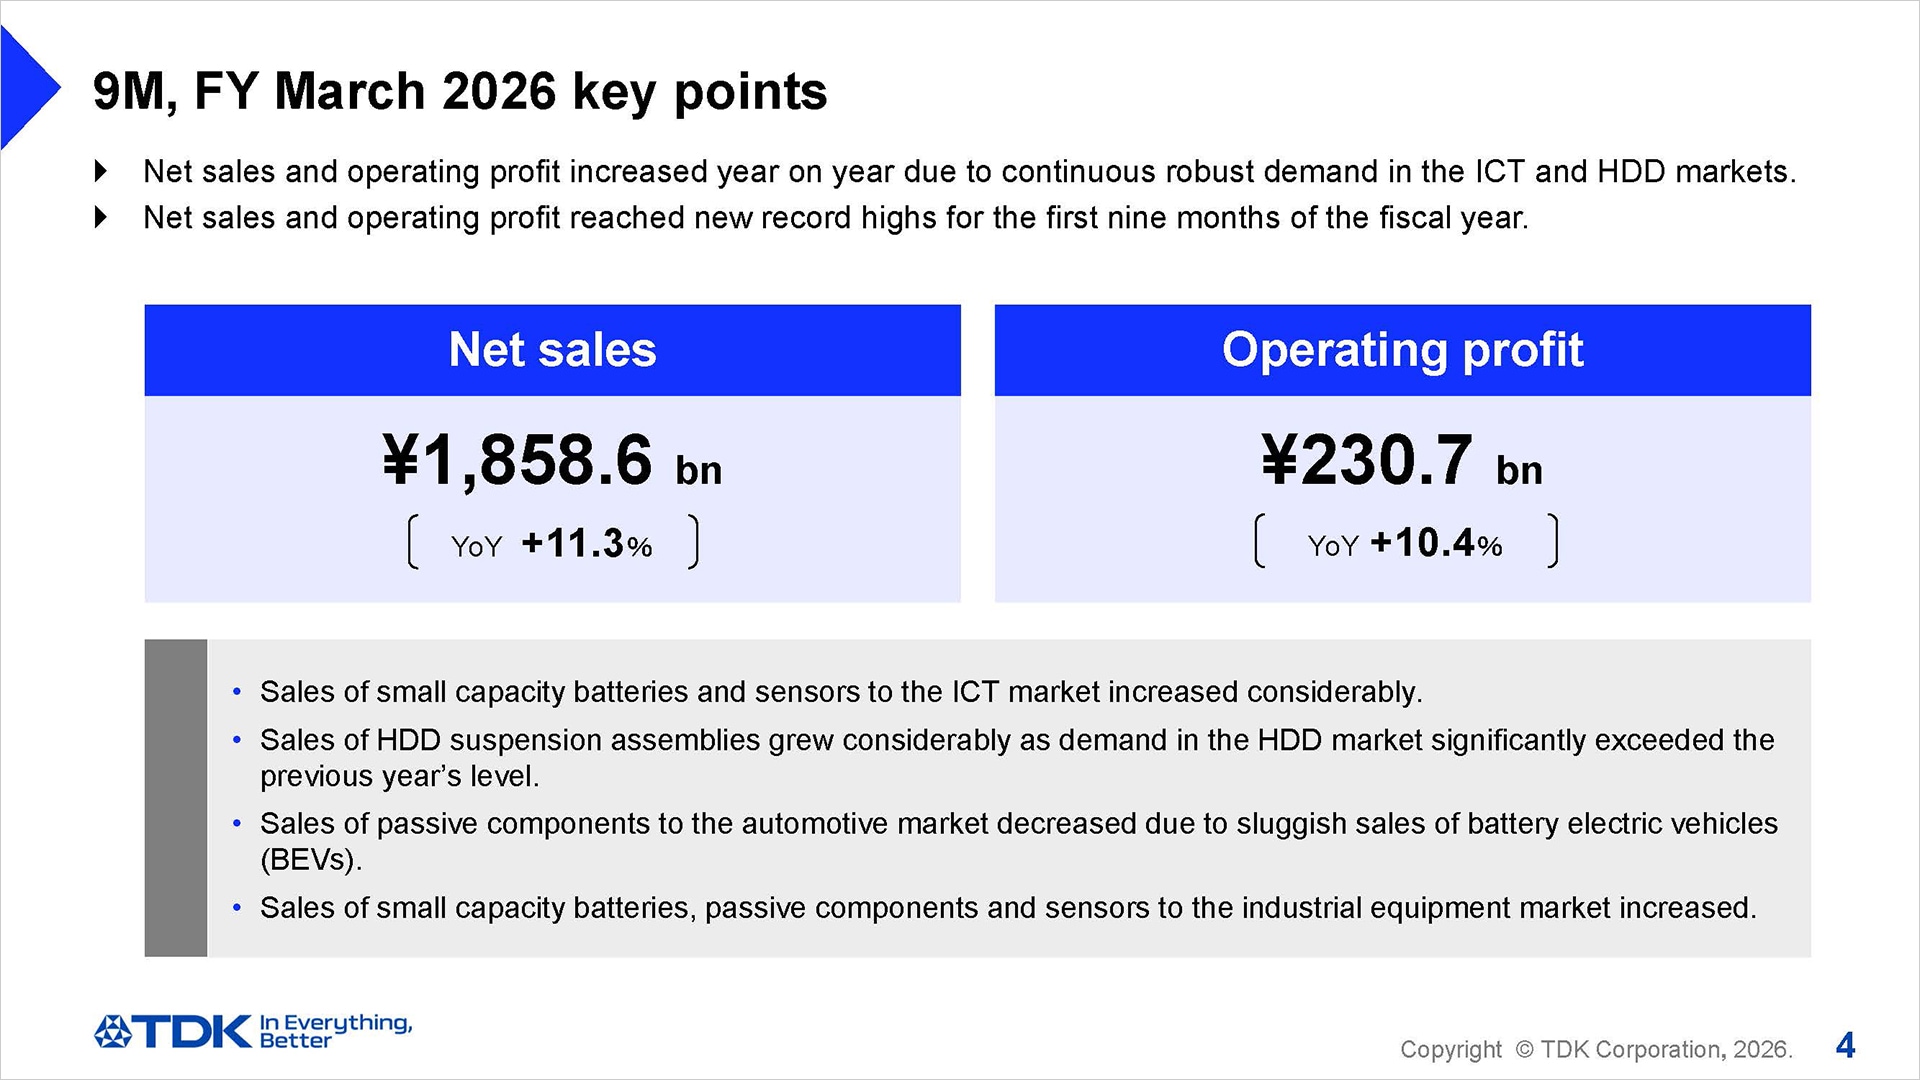
I would like to start with the key points of the first nine months of FY March 2026.
In the electronic components market, which has a significant impact on TDK’s consolidated business results, the production of ICT-related products remained strong on a year-on-year basis. The demand for nearline HDDs for data centers also remained robust. On the other hand, in the automotive market, demand for battery electric vehicles (BEVs) continued to be sluggish, resulting in lower parts demand than forecasted at the beginning of the fiscal year.
In this business environment, during the first nine months of FY March 2026, all segments experienced an increase in sales year on year, driven by robust demand for components in the ICT market and the industrial equipment market.
Overall, net sales and operating profit increased by 11.3% and 10.4%, respectively, reaching new record highs for the first nine months of the fiscal year.
9M, FY March 2026 results
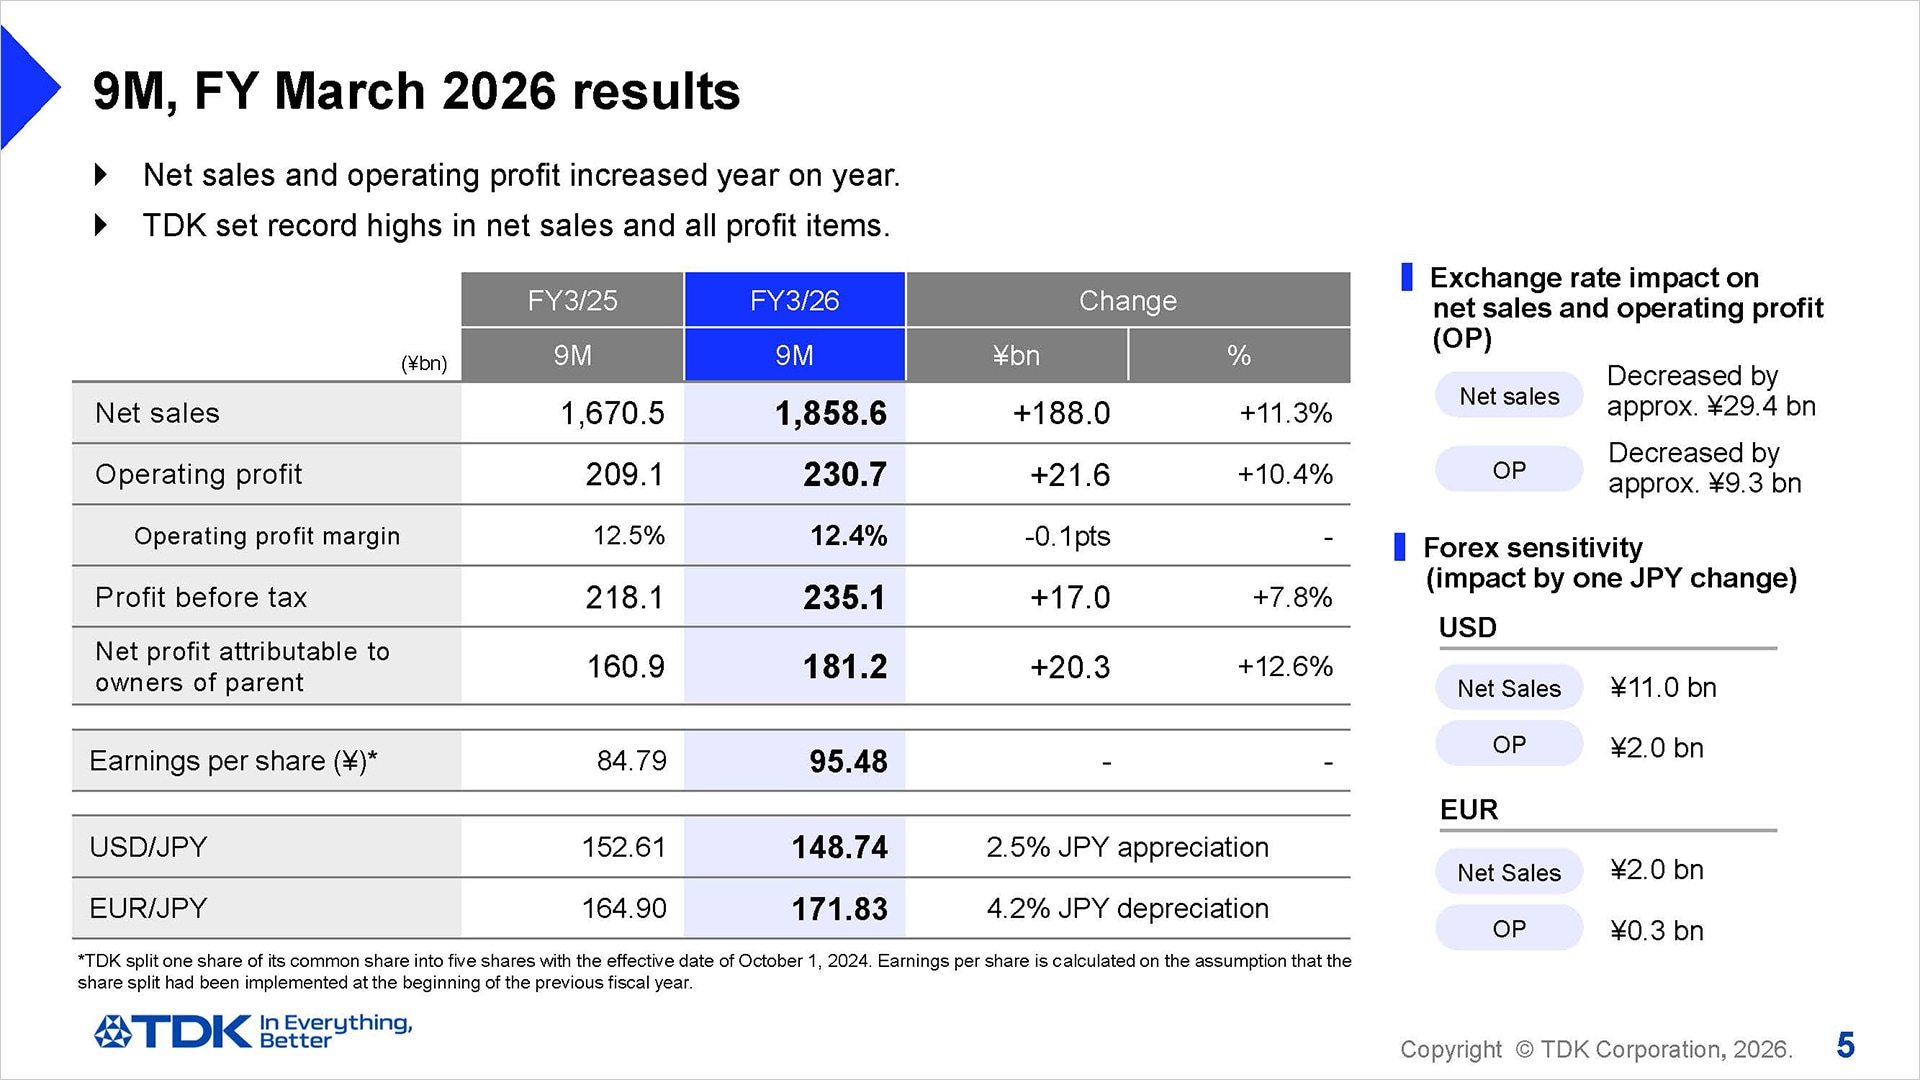
I would like to present an overview of our results for the first nine months of FY March 2026.
There was a decrease of about ¥29.4 billion in net sales and a decrease of about ¥9.3 billion in operating profit due to exchange rate fluctuations against the U.S. dollar and other currencies. Including this impact, net sales were ¥1,858.6 billion, an increase of ¥188.0 billion, or 11.3%, year on year, and operating profit was ¥230.7 billion, an increase of ¥21.6 billion, or 10.4%, year on year. Profit before tax was ¥235.1 billion, an increase of ¥17.0 billion, or 7.8%, year on year. Net profit attributable to owners of parent was ¥181.2 billion, an increase of ¥20.3 billion, or 12.6%, year on year, setting record highs in net sales and all profit items for the first nine months of the fiscal year.
Earnings per share amounted to ¥95.48. In terms of exchange rate sensitivity, we estimate that a change of ¥1 against the U.S. dollar will affect operating profit by about ¥2 billion a year, the same as our previous estimate, while a ¥1 change against the euro will have an impact of about ¥0.3 billion a year.
Passive Components segment
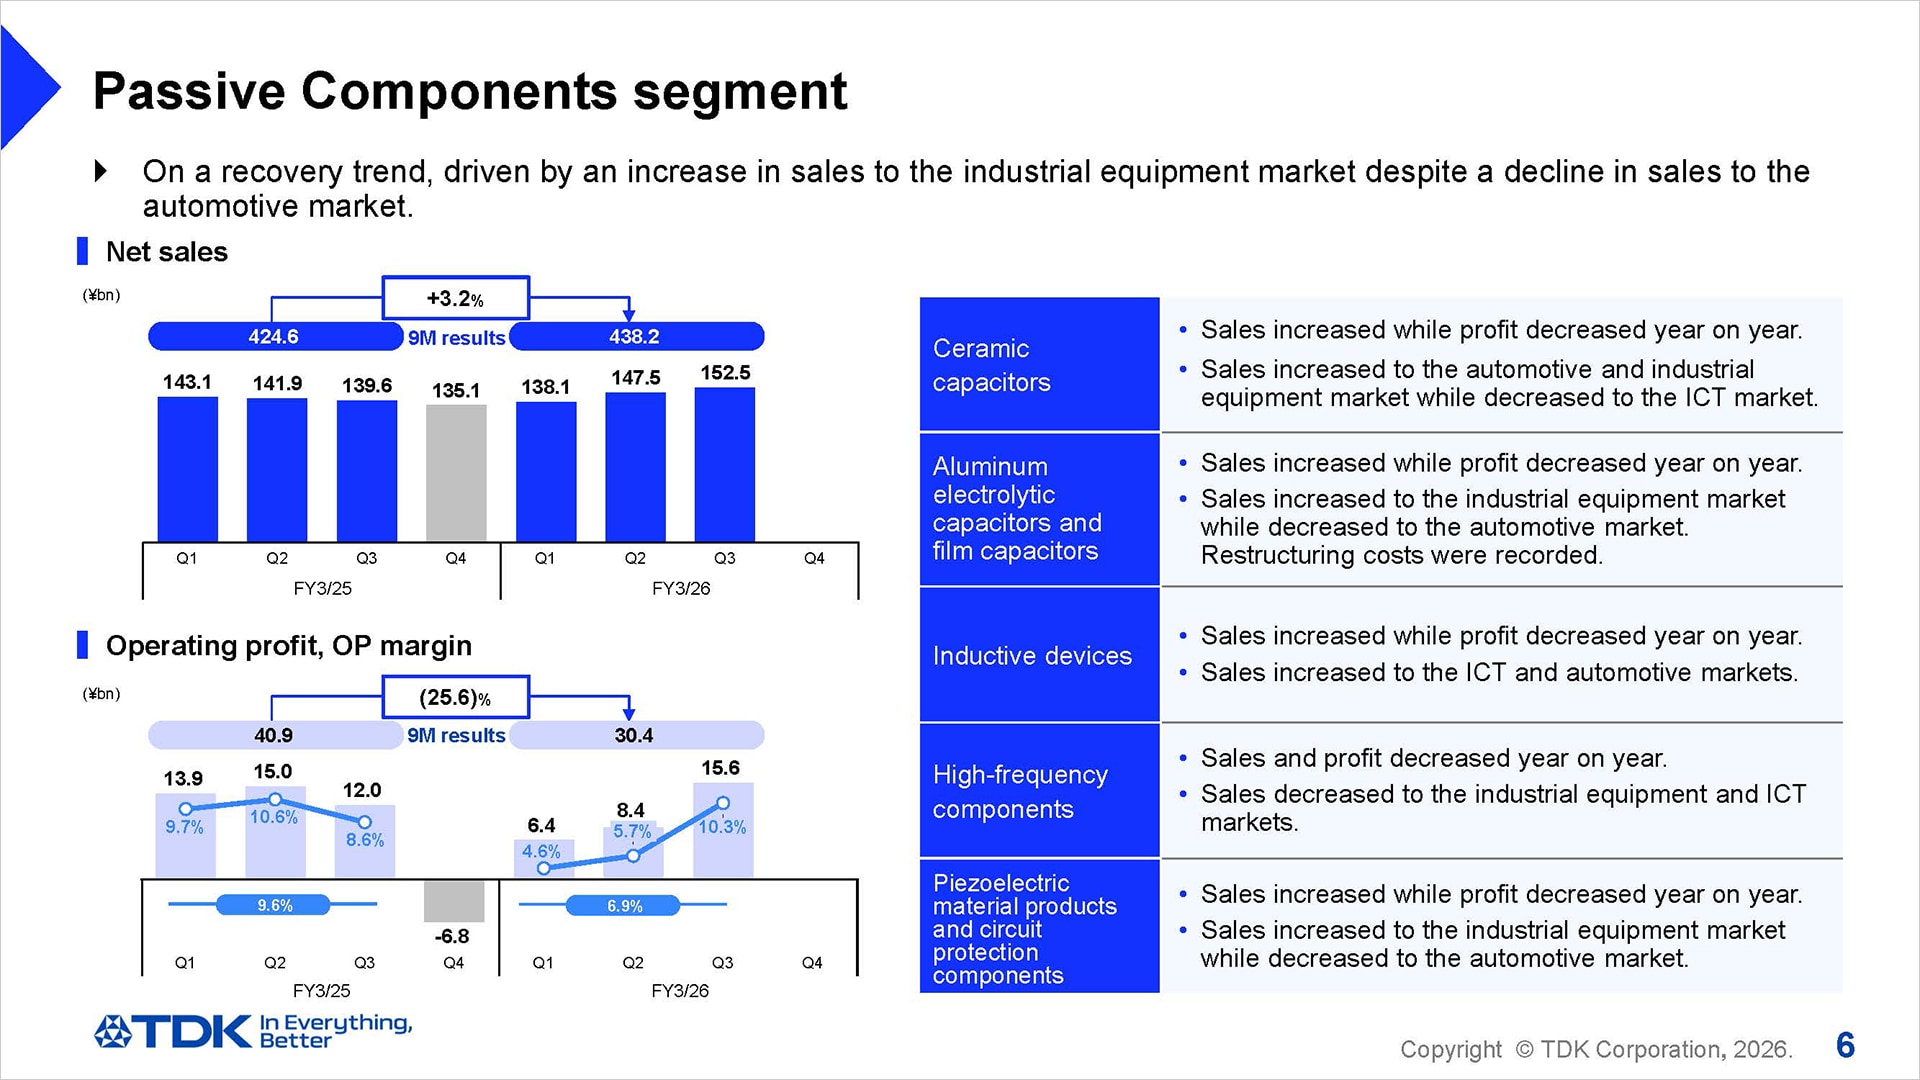
I will now move on to segment results for the first nine months.
In the Passive Components segment, sales to the industrial equipment market increased, whereas sales to the automotive market declined. As a result, net sales amounted to ¥438.2 billion, an increase of 3.2% year on year, while operating profit stood at ¥30.4 billion, a drop of 25.6% year on year.
In ceramic capacitors, sales to the automotive and industrial equipment markets increased, resulting in an increase in sales year on year; however, profit decreased due to lower average selling prices among other factors. In aluminum electrolytic capacitors and film capacitors, sales increased year on year on the back of a rise of sales to the industrial equipment market for renewable energy, AI servers and other applications, despite a drop in sales to the automotive market. Profit increased year on year in real terms when excluding the restructuring costs of ¥2.7 billion recorded in Q2 as part of business portfolio management. Inductive devices saw an increase in sales, reflecting a rise in sales to the ICT and automotive markets, while profit decreased slightly partly due to an unfavorable product mix. Sales and profit decreased year on year for high-frequency components as sales to the industrial equipment and ICT markets declined. Piezoelectric material products and circuit protection components saw an increase in sales on a year-on-year basis, reflecting a rise in sales to the industrial equipment market, while profit decreased due to the stronger yen.
Sensor Application Products segment
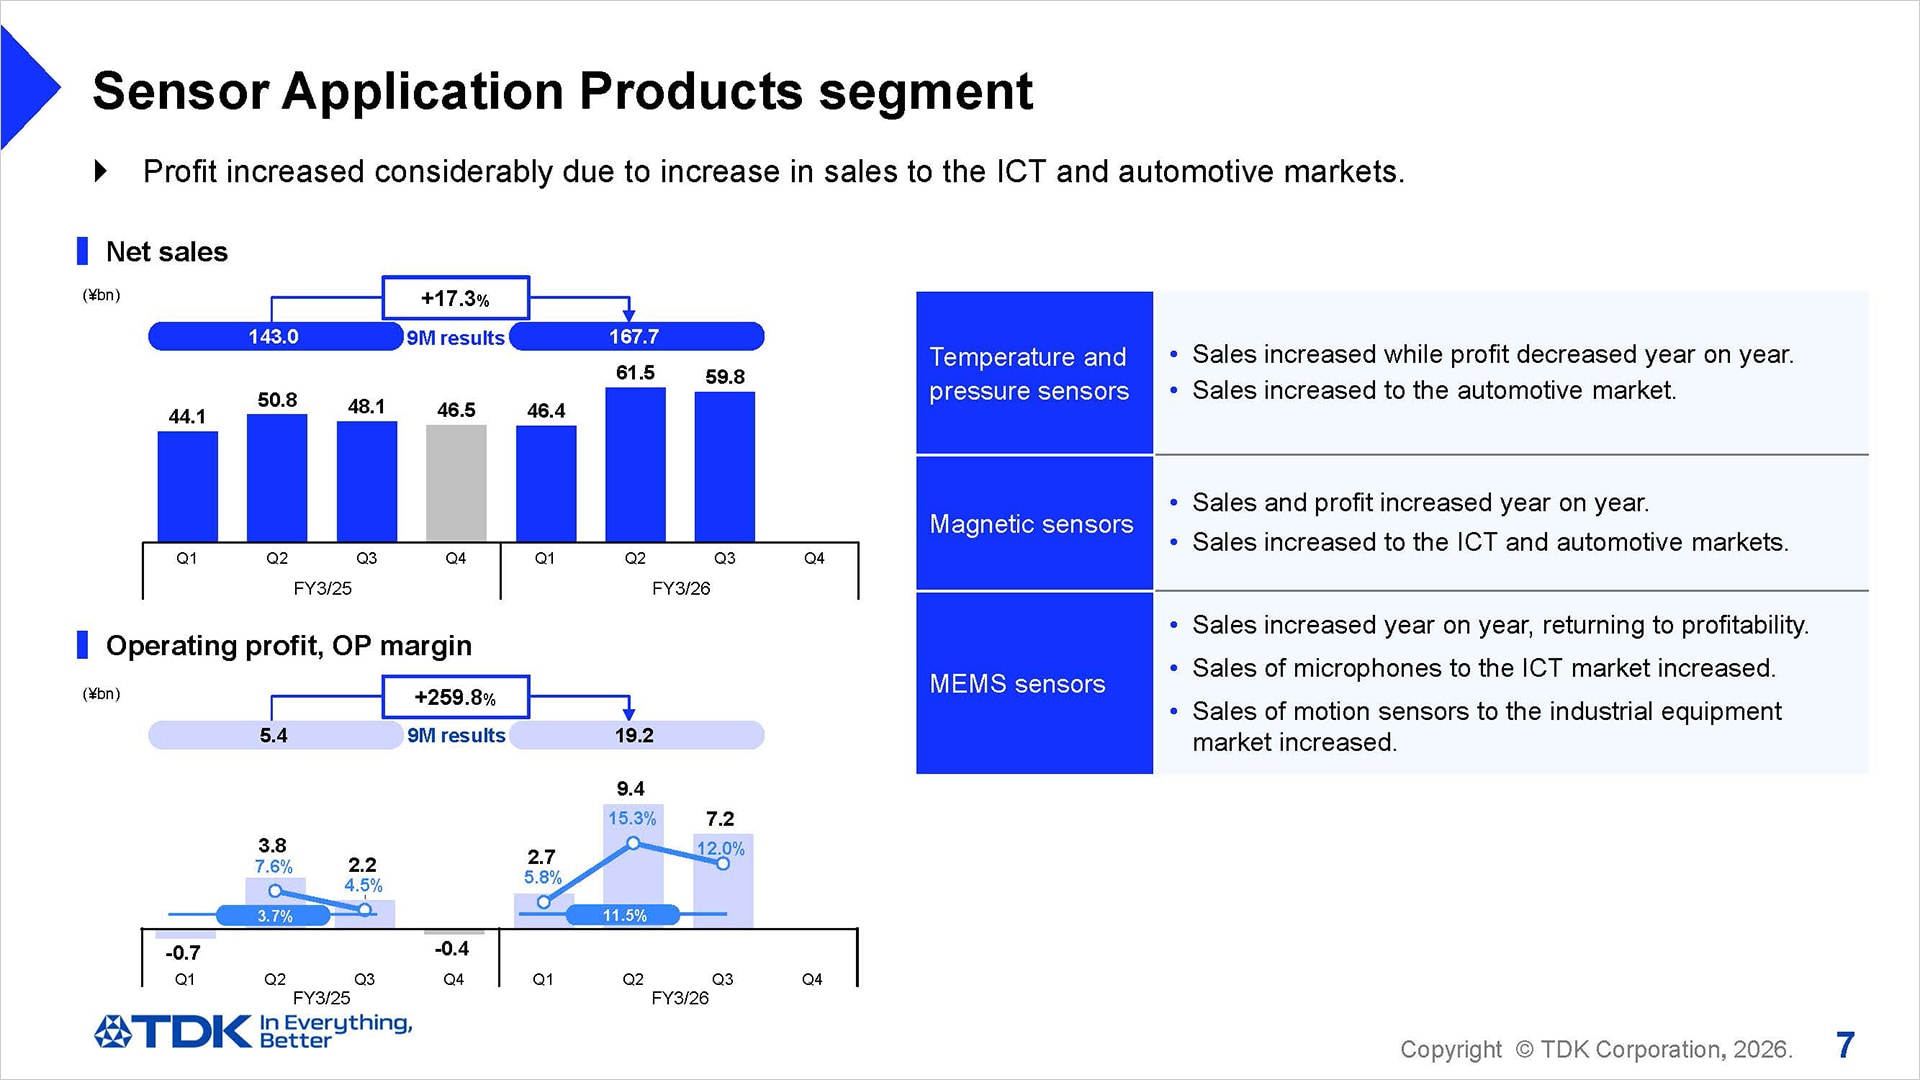
In the Sensor Application Products segment, net sales increased 17.3% year on year to ¥167.7 billion, and operating profit stood at ¥19.2 billion, representing an increase of approximately 3.5 times year on year.
In temperature and pressure sensors, sales increased year on year, reflecting a rise in sale to the automotive market, while profit decreased year on year mainly due to an unfavorable product mix. In magnetic sensors, sales of TMR sensors for smartphone applications rose, resulting in a year-on-year increase in sales and profit of magnetic sensors on the whole. In MEMS sensors, sales of motion sensors to the industrial equipment market increased, on top of a rise in sales of microphones to the ICT market. Consequently, sales of MEMS sensors on the whole increased year on year, returning to profitability. This contributed significantly to the segment’s improved profit.
Magnetic Application Products segment
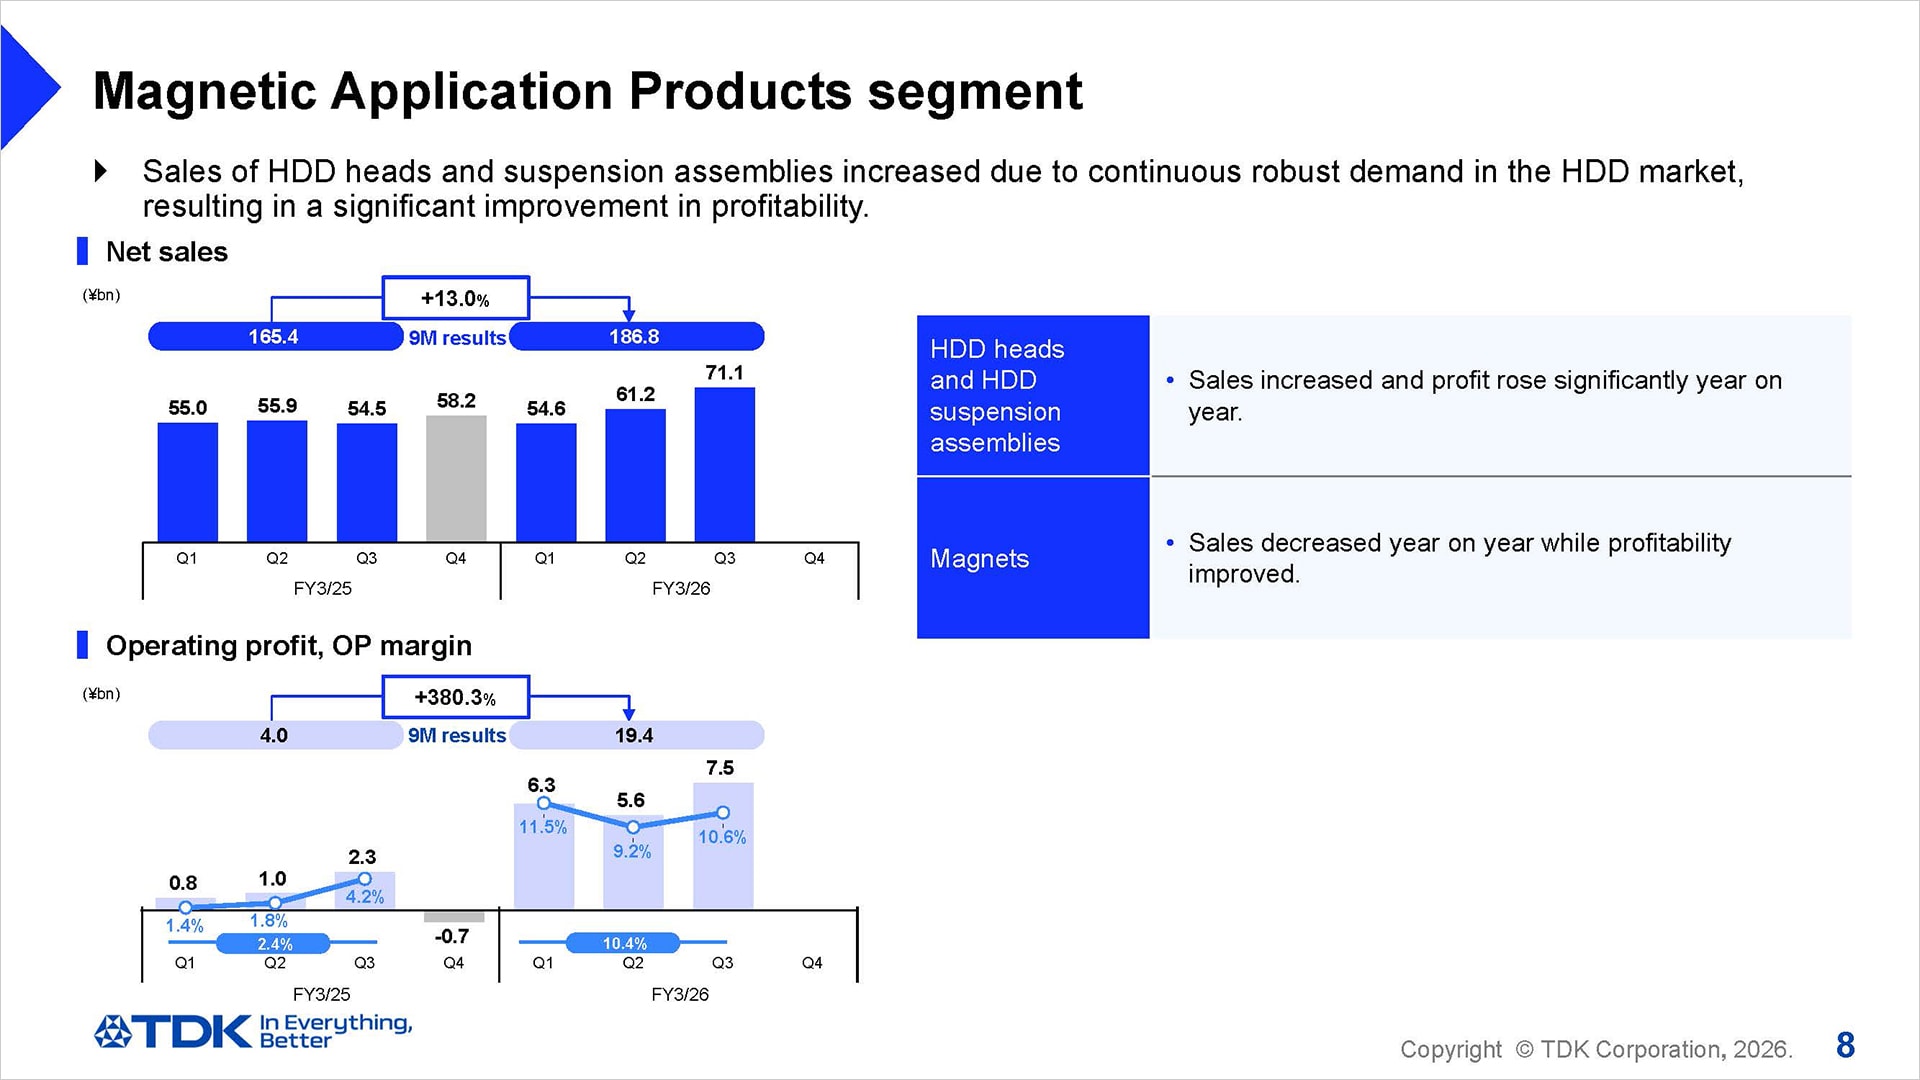
In the Magnetic Application Products segment, net sales increased 13.0% year on year to ¥186.8 billion, and operating profit rose significantly year on year to ¥19.4 billion, representing an increase of nearly 5 times.
In HDD heads and HDD suspension assemblies, sales volumes of heads and suspension assemblies for nearline HDDs increased by approximately 15% and slightly over 30%, respectively. As a result, sales and profit increased considerably. While sales of magnets decreased year on year, profitability improved on the back of cost reduction effects such as quality enhancement, despite posting a loss.
Energy Application Products segment
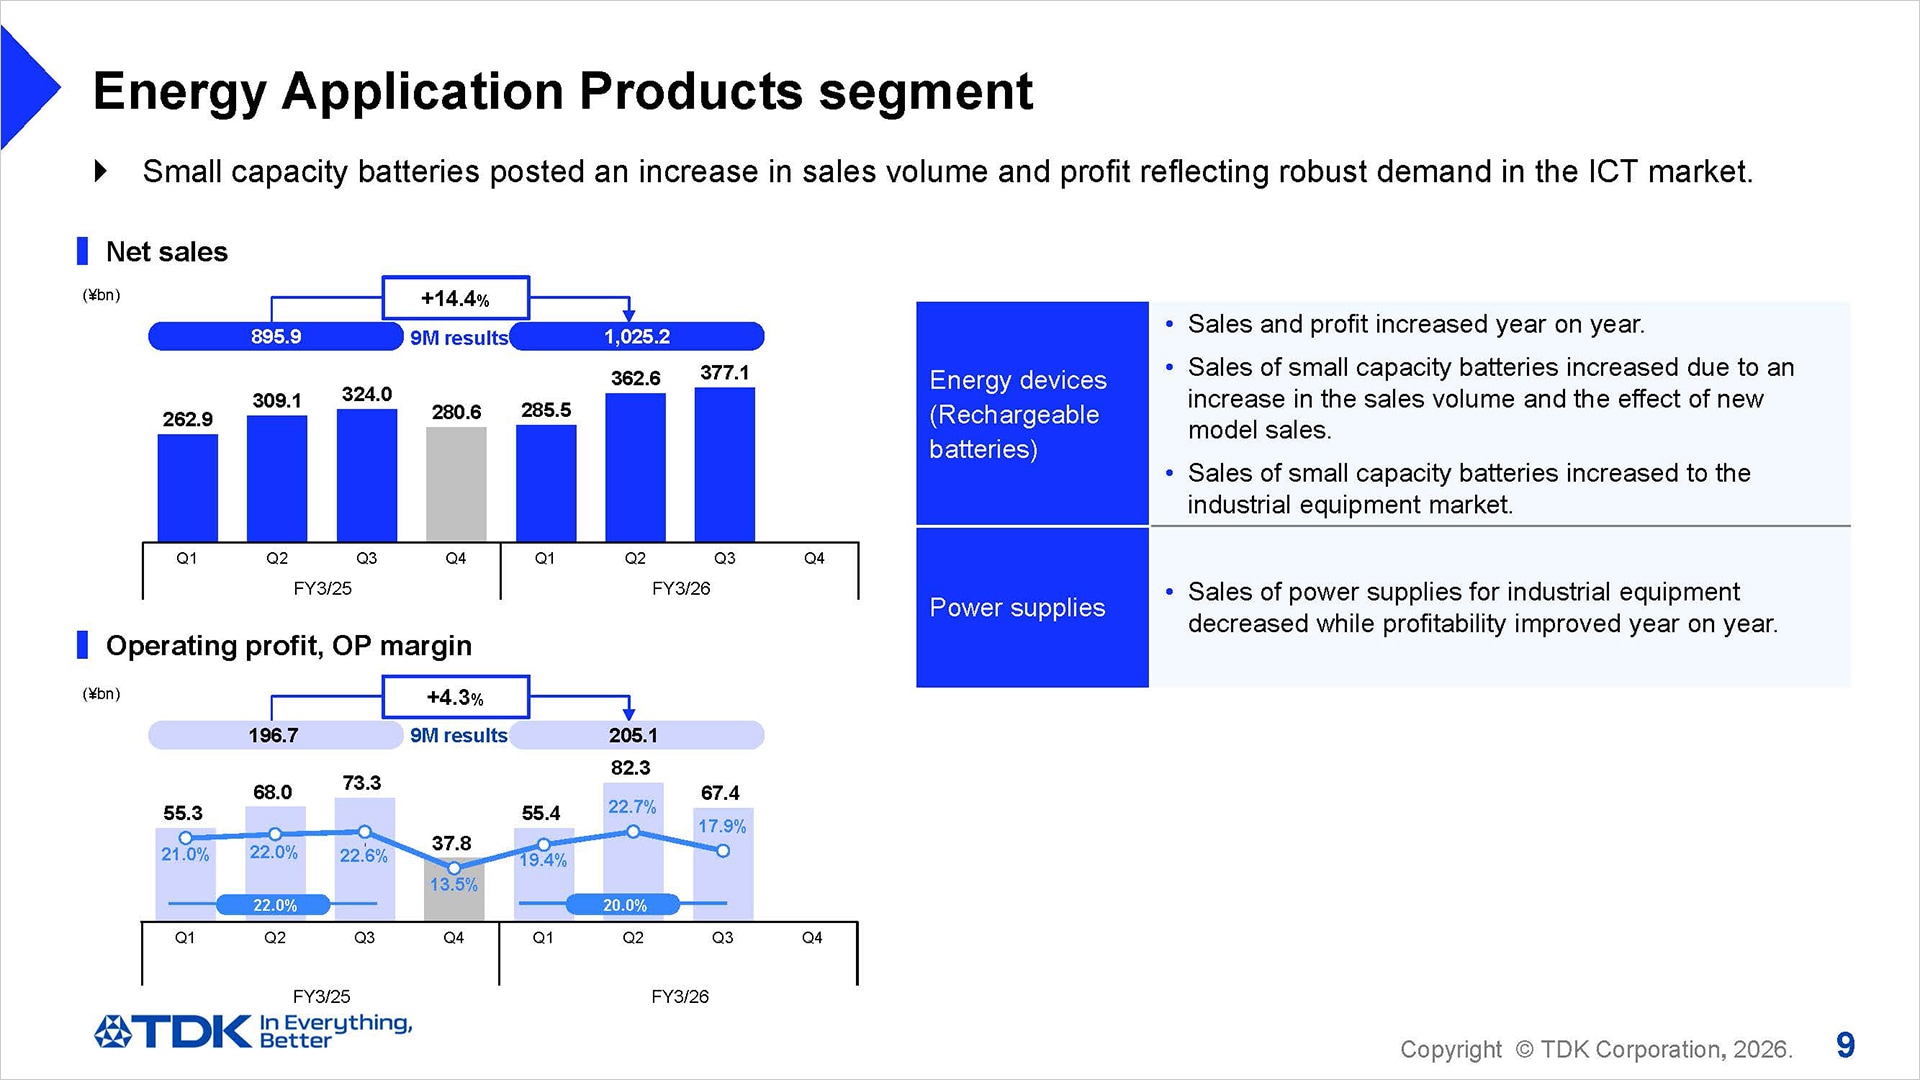
In the Energy Application Products segment, net sales amounted to ¥1,025.2 billion, up 14.4% year on year, and operating profit rose 4.3% year on year to ¥205.1 billion.
In rechargeable batteries, sales increased year on year on the back of a rise in sales volume of small capacity batteries for smartphone applications and the effect of new model sales. Sales of medium capacity batteries to the industrial equipment market also increased, resulting in an increase in both sales and profit of rechargeable batteries on the whole. Power supplies for industrial equipment saw a year-on-year decline in sales as demand for industrial equipment applications failed to recover significantly; however, profit increased, mainly reflecting a more favorable product mix.
Q3, FY March 2026 results
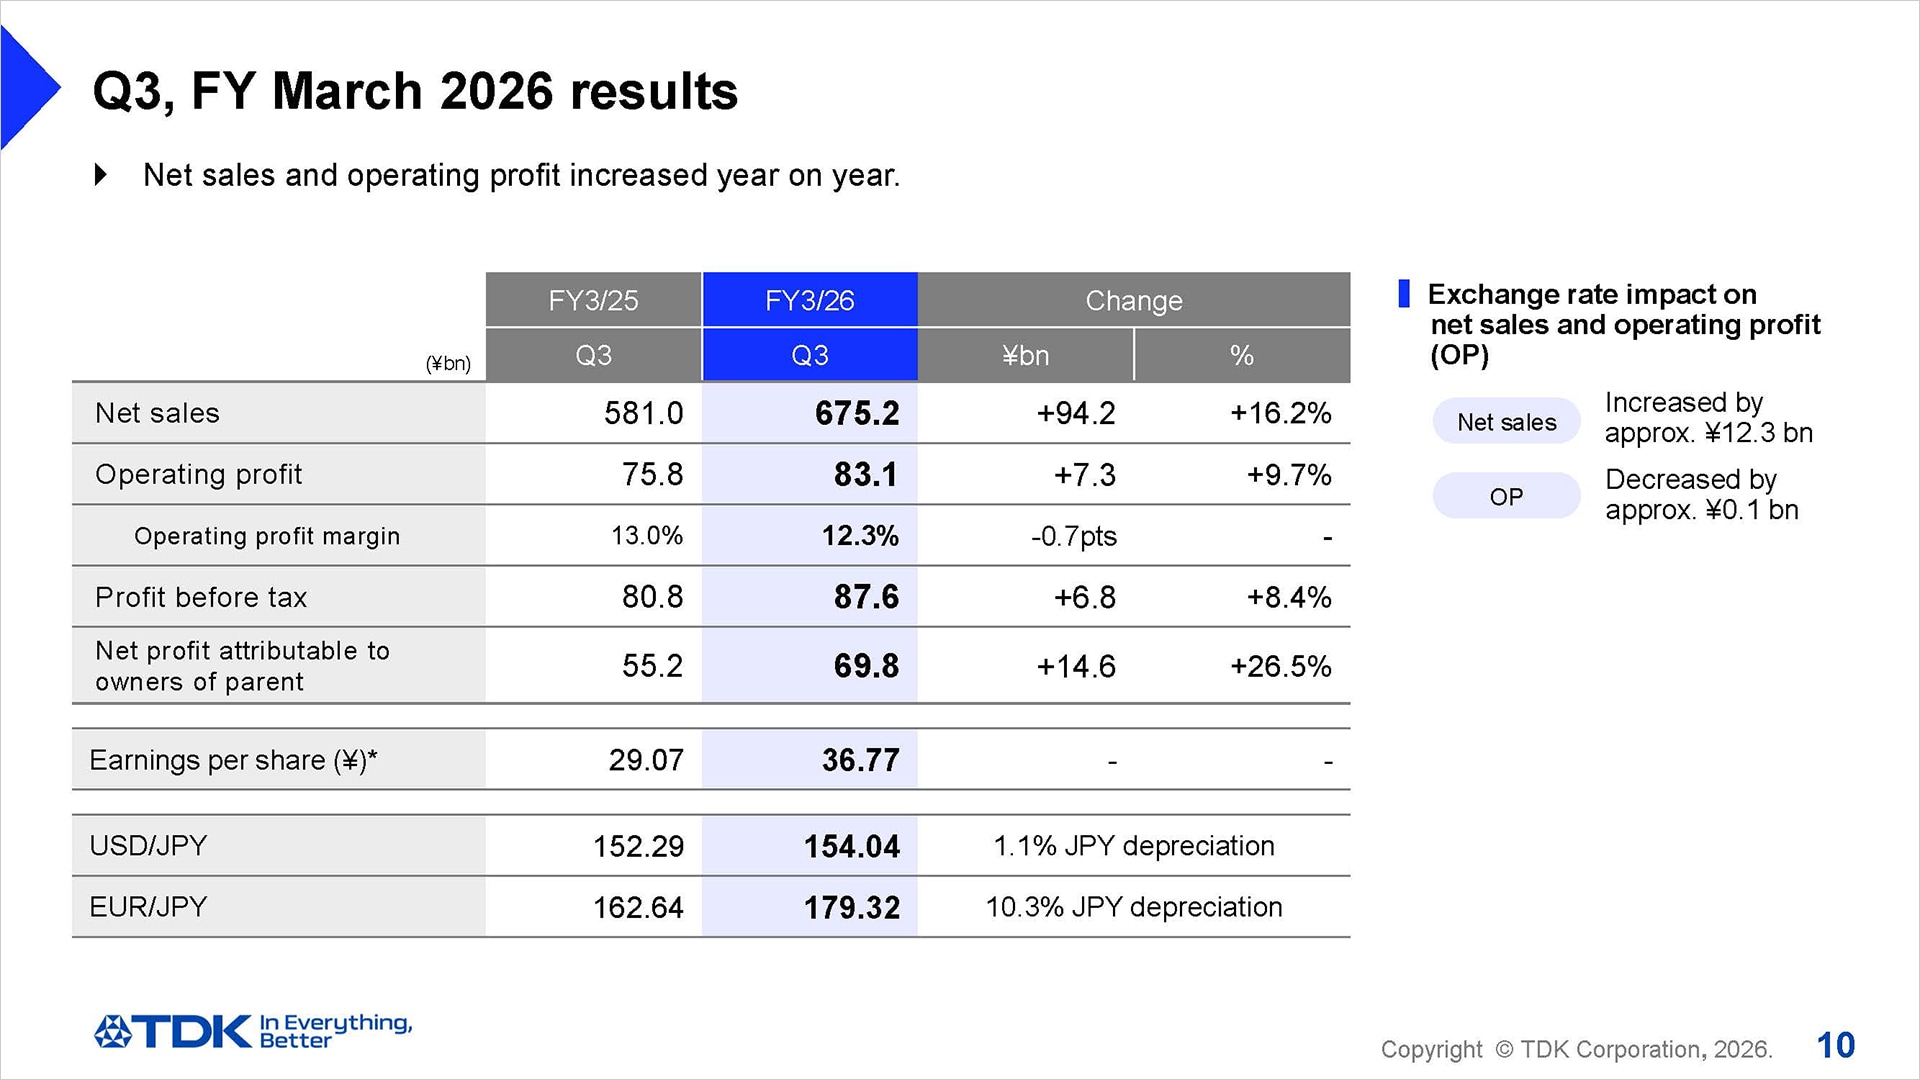
I would like to present an overview of our results for Q3.
There was an increase of about ¥12.3 billion in net sales and a decrease of about ¥0.1 billion in operating profit due to exchange rate fluctuations against the U.S. dollar and other currencies. Including this impact, net sales were ¥675.2 billion, an increase of ¥94.2 billion, or 16.2%, year on year, and operating profit was ¥83.1 billion, an increase of ¥7.3 billion, or 9.7%, year on year. Profit before tax was ¥87.6 billion, an increase of ¥6.8 billion, or 8.4%, year on year. Net profit attributable to owners of parent was ¥69.8 billion, a significant increase of ¥14.6 billion, or 26.5%, year on year.
Earnings per share turned out to be ¥36.77.
Quarterly results by segment
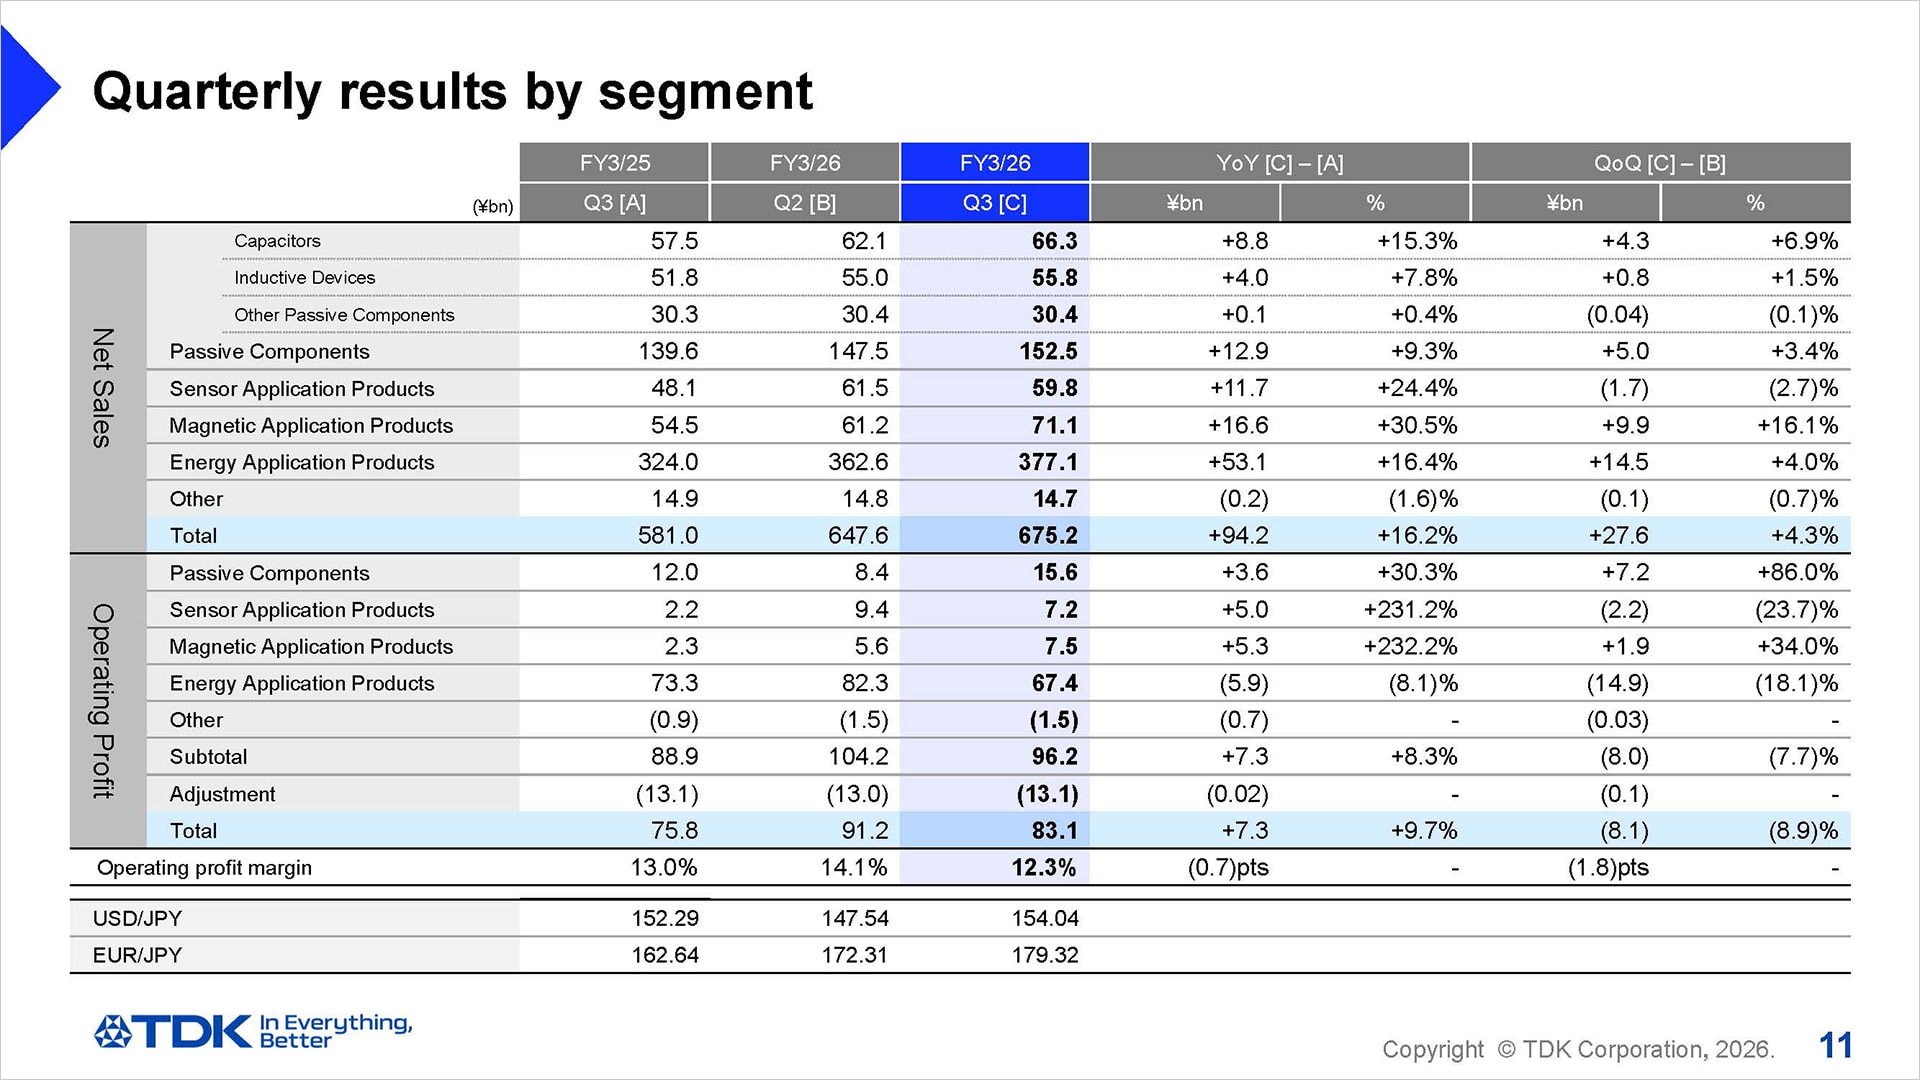
I will now explain some of the factors behind the changes in segment sales and operating profit from Q2 to Q3 of FY March 2026.
In the Passive Components segment, net sales increased by ¥5.0 billion, or 3.4%, from Q2, and operating profit increased by ¥4.5 billion from Q2, when excluding one-time expenses of ¥2.7 billion. Sales and profit of ceramic capacitors increased reflecting a rise in sales to the automotive market. Sales and profit of aluminum electrolytic capacitors and film capacitors virtually remained unchanged when excluding the restructuring costs of ¥2.7 billion recorded in Q2. Sales of inductive devices increased on the back of a rise in sales to the automotive market, while profit remained at the same level as Q2, reflecting an unfavorable product mix among other factors. While sales of high-frequency components decreased as sales to the automotive market declined, profit increased reflecting a more favorable product mix and other factors. Sales and profit of piezoelectric material products and circuit protection components increased driven by higher sales to the industrial equipment market.
In the Sensor Application Products segment, net sales decreased by ¥1.7 billion, or 2.7%, from Q2, and operating profit decreased by ¥2.2 billion from Q2. Sales and profit of temperature and pressure sensors decreased reflecting a drop in sales to the automotive market. Magnetic sensors saw a slight decrease in sales and profit on the whole reflecting a seasonal decrease in demand for TMR sensors from the ICT market. In MEMS sensors, sales of microphones to the ICT market decreased reflecting a seasonal decrease in demand. Sales of motion sensors also decreased mainly for industrial equipment applications. As a result, sales and profit of MEMS sensors decreased on the whole; however, profitability was maintained.
In the Magnetic Application Products segment, net sales increased by ¥9.9 billion, or 16.1%, from Q2, and operating profit increased by ¥1.9 billion, or 34%, from Q2. While sales volume of HDD heads remained almost unchanged, sales increased on the back of a rise in average selling prices reflecting a favorable change in new product mix. Sales volume of HDD suspension assemblies rose about 23% reflecting an increase in demand for nearline HDDs. As a result, sales and profit of HDD heads and suspension assemblies increased on the whole. As for magnets, sales increased due to progress in price pass-through of higher material costs, resulting in a reduced loss.
In the Energy Application Products segment, net sales increased by ¥14.5 billion, or 4.0%, from Q2, while operating profit decreased by ¥14.9 billion, or 18.1%, from Q2. While sales volume of small capacity batteries to the ICT market decreased due to seasonality, sales of rechargeable batteries increased on the whole reflecting a rise in sales of small capacity battery packs. On the other hand, operating profit decreased reflecting the impact of a significant rise in material prices. Sales and profit of power supplies for industrial equipment remained virtually unchanged. While sales of power supplies for EVs decreased due to lower demand for BEVs, loss was reduced.
Analysis of change in operating profit – 9M
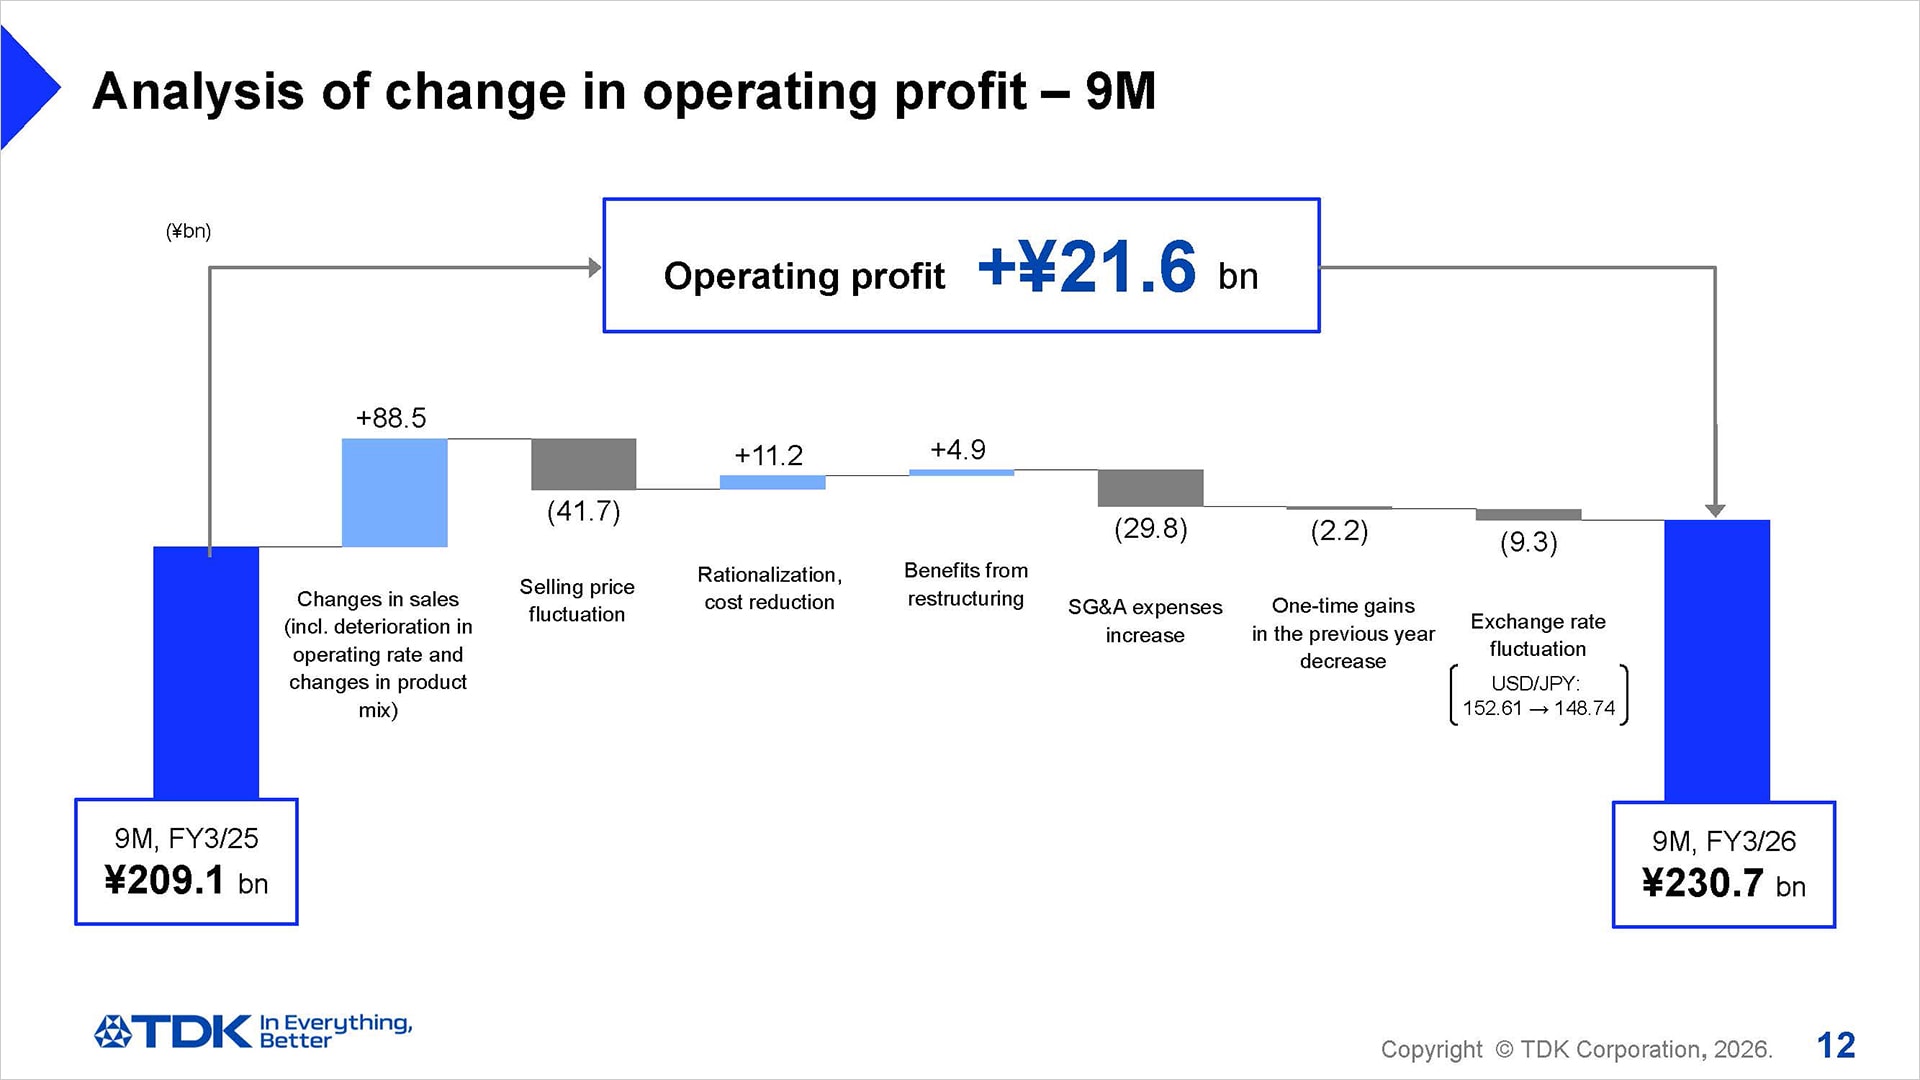
Next is an analysis of the ¥21.6 billion year-on-year increase in operating profit for the first nine months of FY March 2026.
Changes in sales increased by ¥88.5 billion due to an increase in the sales volume of rechargeable batteries, HDD heads and HDD suspension assemblies, and sensors. While there were positive effects on operating profit including rationalization and cost reduction of ¥11.2 billion and benefits from restructuring carried out in the previous fiscal year of ¥4.9 billion, operating profit declined by ¥41.7 billion due to selling price fluctuation reflecting the impact of discounts on selling prices. SG&A expenses increased by ¥29.8 billion reflecting an increase in R&D expenses mainly related to rechargeable batteries, for which TDK has been accelerating the development of new technologies and products. There was also a ¥2.2 billion decrease in one-time gains recorded in the previous fiscal year. These factors, along with the positive effect of an increase in sales volume, contributed to the ¥21.6 billion increase in operating profit on the whole, despite the negative effect of the stronger yen amounting to ¥9.3 billion.
Cash flows – 9M
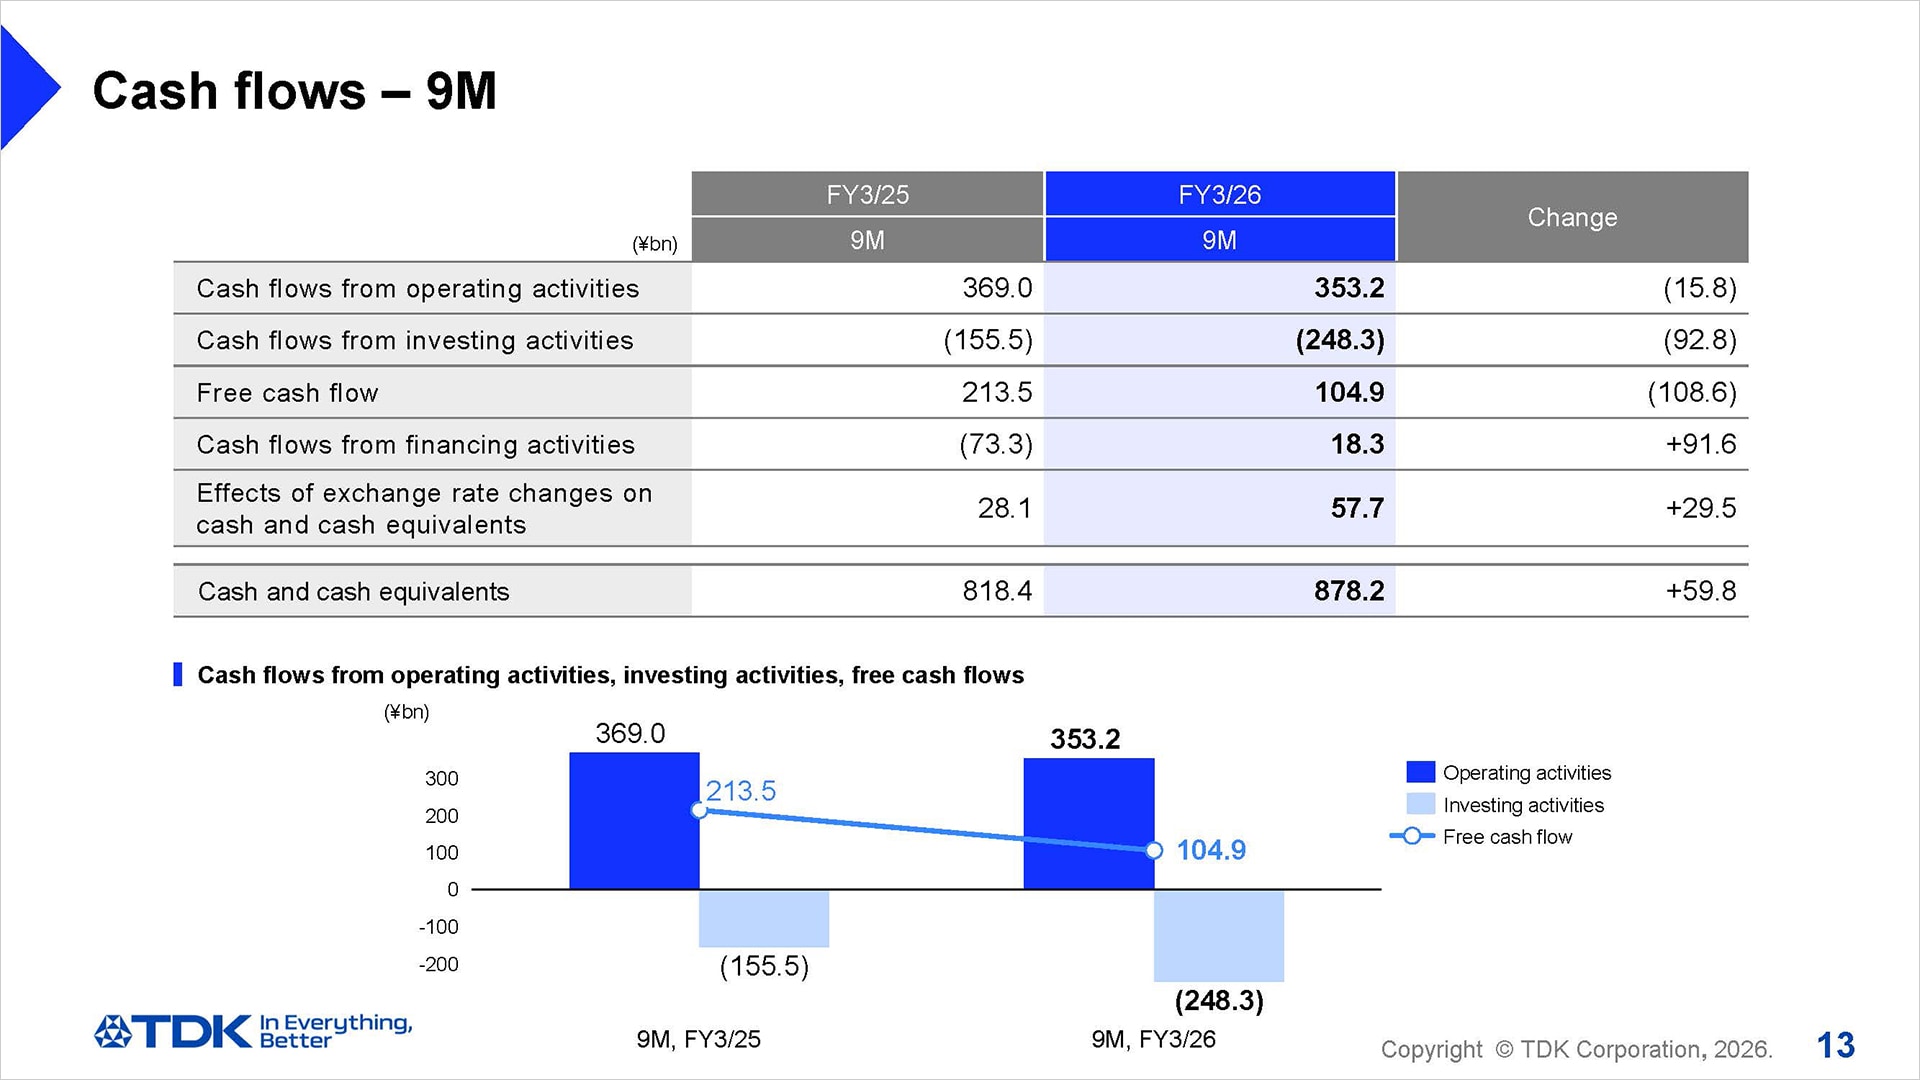
I would like to present an overview of cash flows.
In the first nine months of FY March 2026, operating cash flow amounted to ¥353.2 billion. Investing cash flow increased overall by ¥92.8 billion year on year, reflecting higher capital expenditures mainly related to rechargeable batteries, including investments related to new products and technologies. Free cash flow decreased by ¥108.6 billion year on year to ¥104.9 billion, but exceeded the level forecasted for the nine-month period.
FY March 2026 Projections
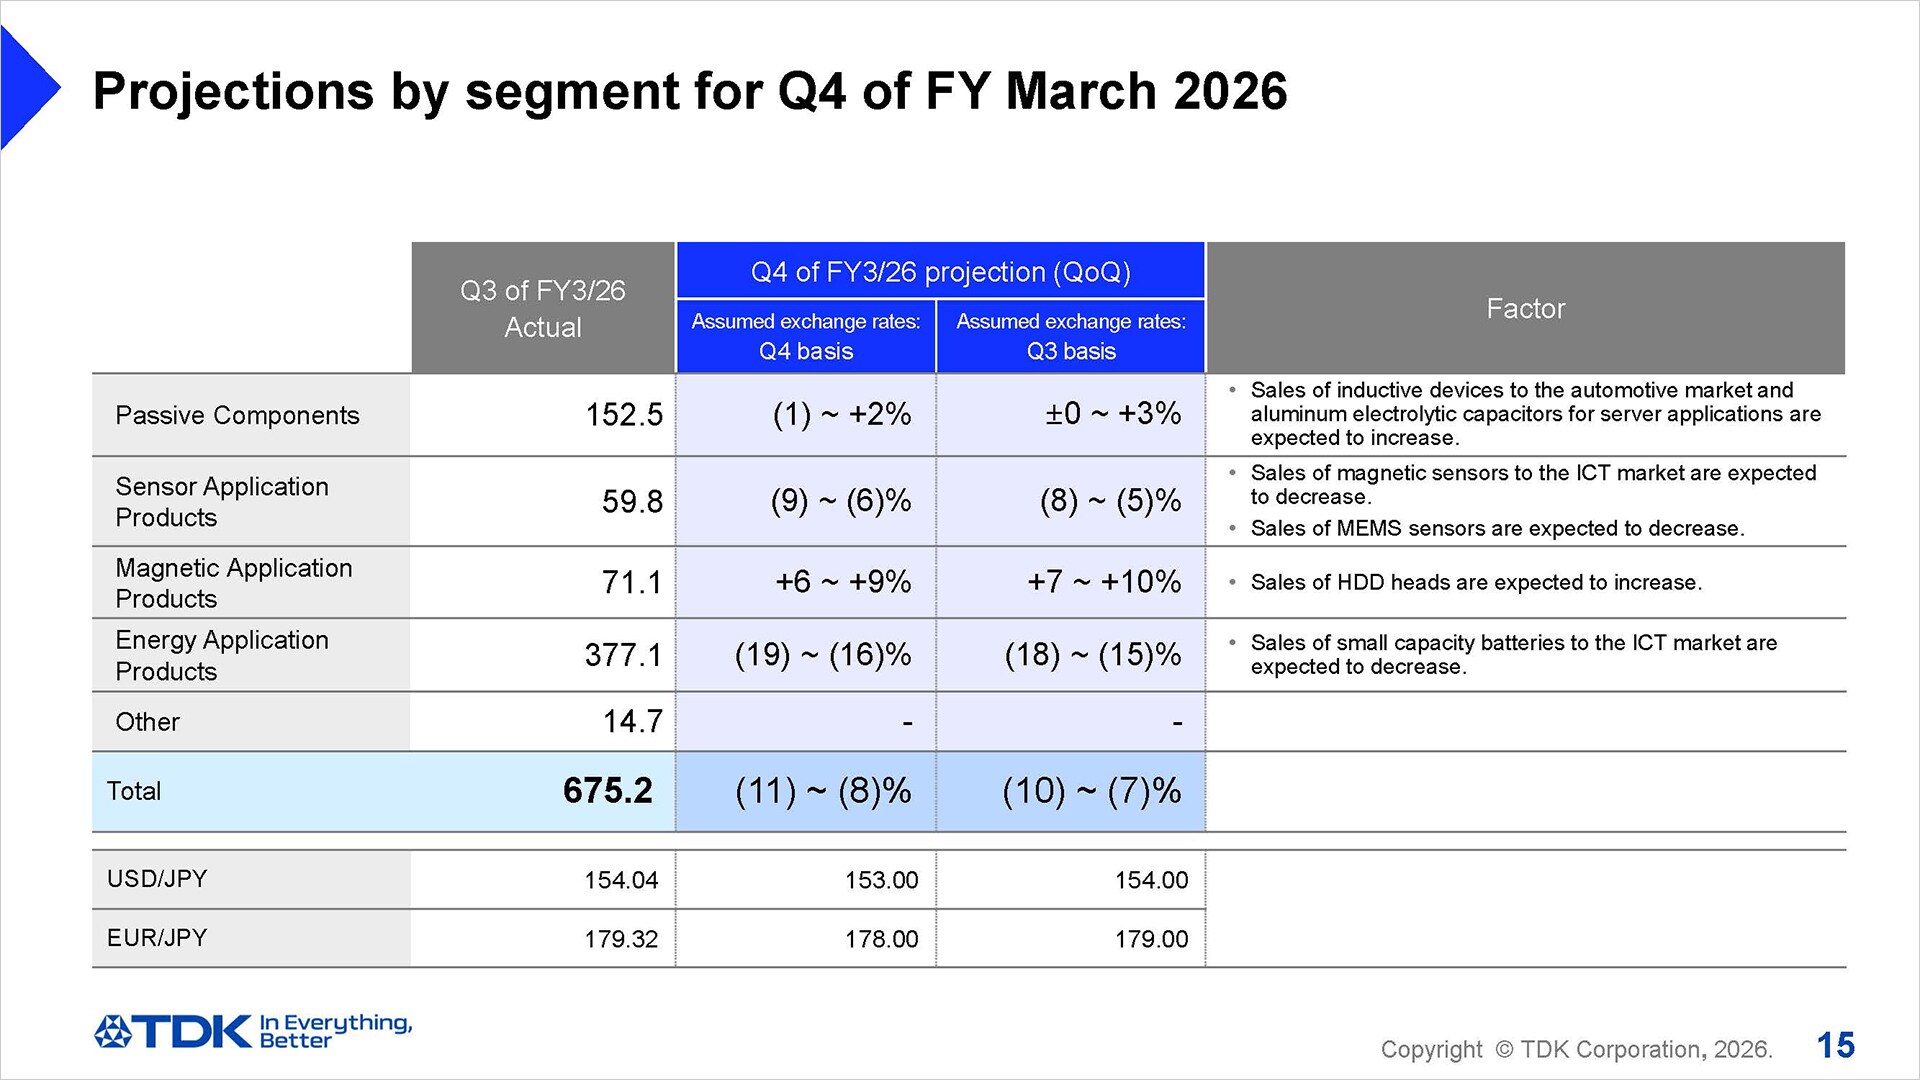
Projections by segment for Q4 of FY March 2026
I would like to explain our FY March 2026 projections.
I would like to discuss our projections regarding changes in segment net sales for Q4.
We have revised our exchange rate assumption for Q4 from ¥145 to the U.S. dollar to ¥153 to the U.S. dollar. However, for the sake of easier comparison, I will provide explanations by adjusting this to the exchange rate for Q3.
In the Passive Components segment, we expect overall sales growth between ±0% and +3% on a quarter-on-quarter basis. This is attributable mainly to an increase in sales of inductive devices to the automotive market and an increase in sales of aluminum electrolytic capacitors for AI server applications.
In the Sensor Application Products segment, we expect overall sales growth between -8% and -5% on a quarter-on-quarter basis. This is attributable mainly to a decrease in sales of magnetic sensors and MEMS sensors for smartphone applications due to seasonality.
In the Magnetic Application Products segment, we expect overall sales growth between +7% and +10% on a quarter-on-quarter basis. This is attributable mainly to the fact that the sales volume of HDD heads is expected to increase by approximately 8% and that of HDD suspension assemblies is expected to decrease by approximately 6% due to some advance orders received in Q3, among other factors.
In the Energy Application Products segment, we expect overall sales growth between -18% and -15% on a quarter-on-quarter basis. This is attributable mainly to a decline in sales of small capacity batteries for smartphone applications due to seasonality.
FY March 2026 projections
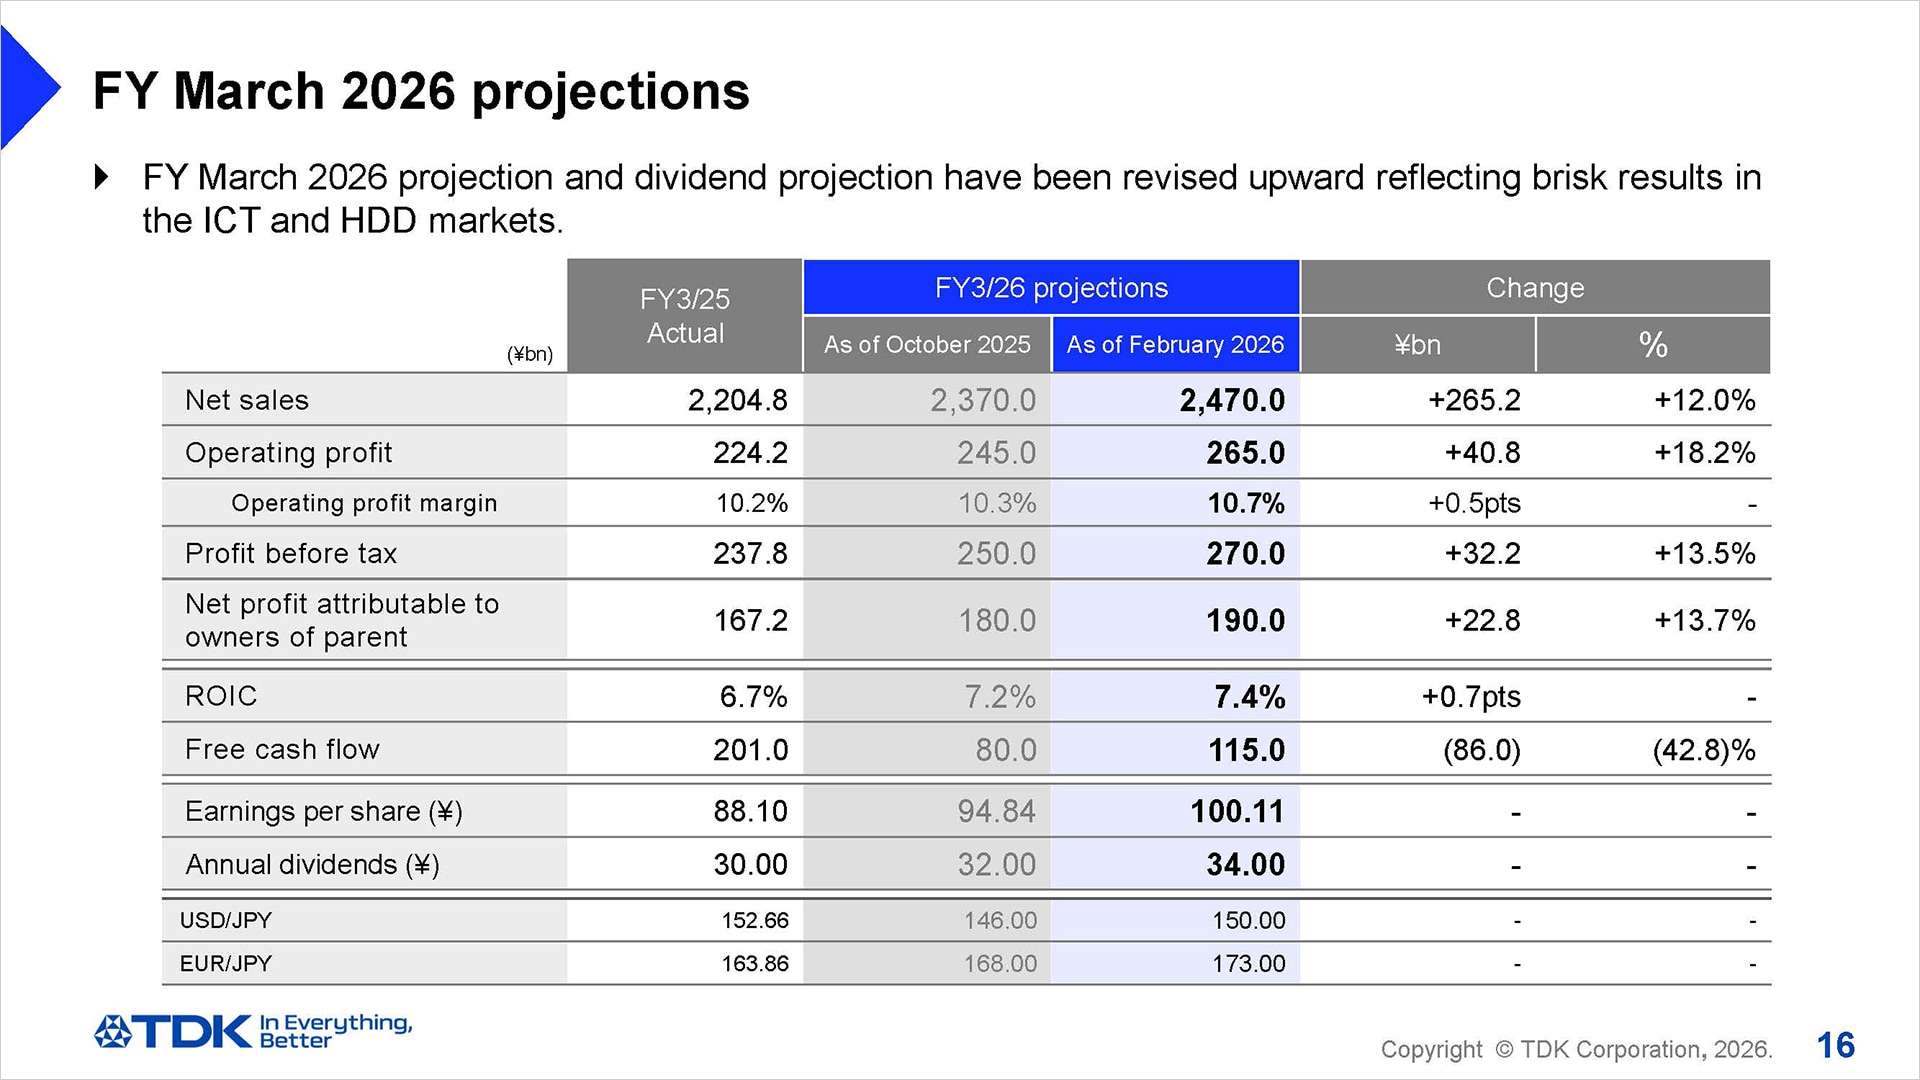
I would now like to go over our full-year projections for FY March 2026.
As explained earlier, in the electronics market during the first nine months of FY March 2026, sales of rechargeable batteries and sensors increased, supported by the launch of new smartphone models, among other factors. In addition, sales of HDD suspension assemblies remained robust as demand for HDDs related to data centers continued to show strength. Under such circumstances, TDK’s performance for the first nine months of FY March 2026 exceeded the projections announced on October 31, 2025, reflecting the impact of the yen trending weaker than anticipated.
As a result of a review of full-year projections in light of the above conditions, TDK has revised upward its consolidated projections for FY March 2026 from the previously announced projections as follows: net sales of ¥2,470.0 billion, operating profit of ¥265.0 billion, and net profit attributable to owners of parent of ¥190.0 billion.
Our exchange rate assumption for Q4 of FY March 2026 is ¥153 against the U.S. dollar.
In addition, supported by higher profit contributions, TDK also revised upward its free cash flow projection by ¥35.0 billion from the previous announcement to ¥115.0 billion.
Furthermore, as part of its effort to drive business portfolio management, TDK will recognize operating expenses of approximately ¥13.0 billion in total for FY March 2026. This reflects an additional one-time expenses of approximately ¥3.0 billion, including restructuring costs, to be recorded in Q4 compared to the previous forecast.
As for our projections for dividend per share, in light of the upward revision to profit, we revised the year-end dividend projection upward by ¥2 per share to ¥18, from ¥16. As a result, the annual dividend projection has been revised from ¥32 per share to ¥34 per share.
CAPEX, Depreciation, and R&D expenses – Projections
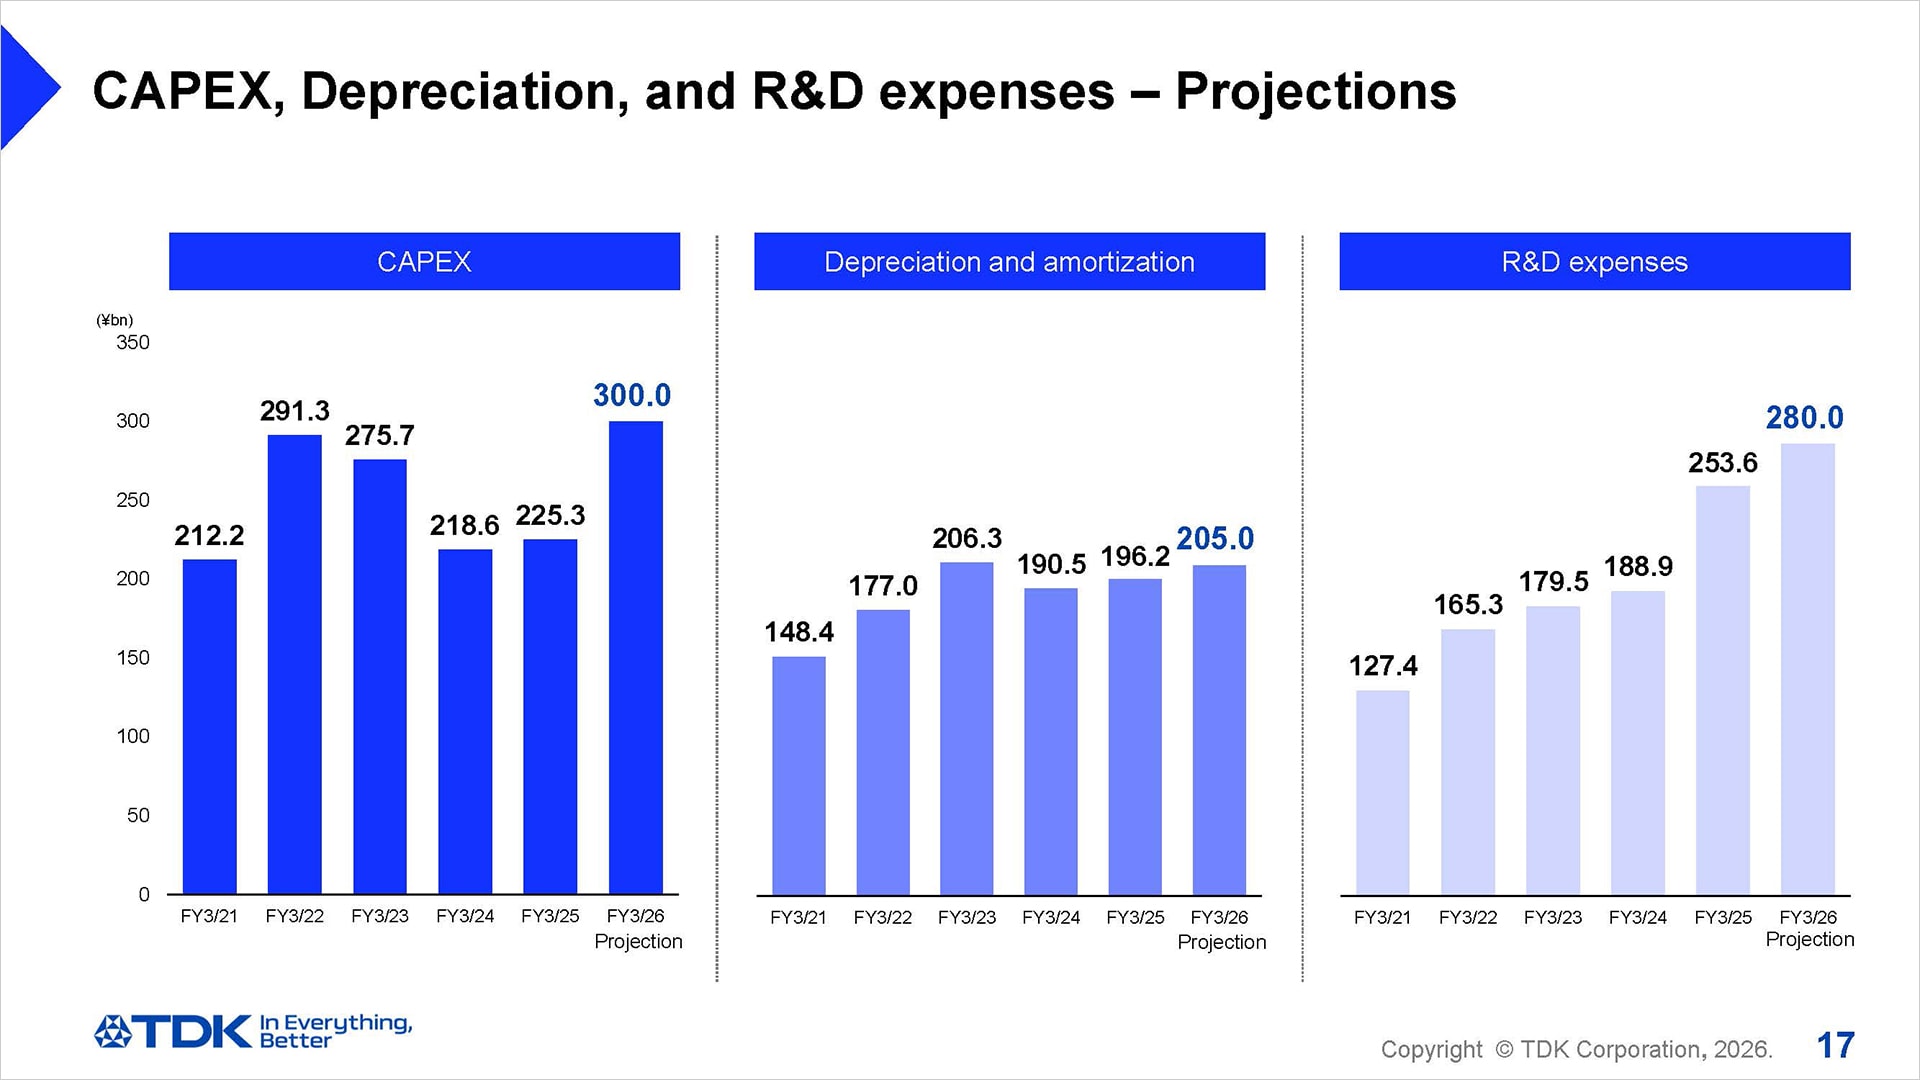
Along with an upward revision to the full-year projections, we also reviewed various expenses.
Capital expenditures (CAPEX) are now projected at ¥ 300.0 billion, up ¥20.0 billion yen from the previous forecast of ¥280.0 billion, depreciation and amortization at ¥205.0 billion, up ¥5.0 billion, and R&D expenses at ¥280.0 billion, up 20.0 billion yen. These increases mainly reflect the upcoming launch of new products and the acceleration of development of new technologies in rechargeable batteries. We are preparing for further growth toward achieving our targets next fiscal year, which is the final year of our Medium-term Plan.
This concludes my presentation.
Thank you for your attention.


