3rd Quarter of fiscal 2024 Performance Briefing
Q3, FY March 2024 Results Highlights
FY March 2024 Projections

Mr. Tetsuji Yamanishi
Executive Vice President
Hello, I am Tetsuji Yamanishi, Executive Vice President of TDK. Thank you for taking the time to attend TDK’s performance briefing for the first nine months of the fiscal year ended March 2024. I will be presenting an overview of our consolidated results.
Q3 (YTD), FY March 2024 key points
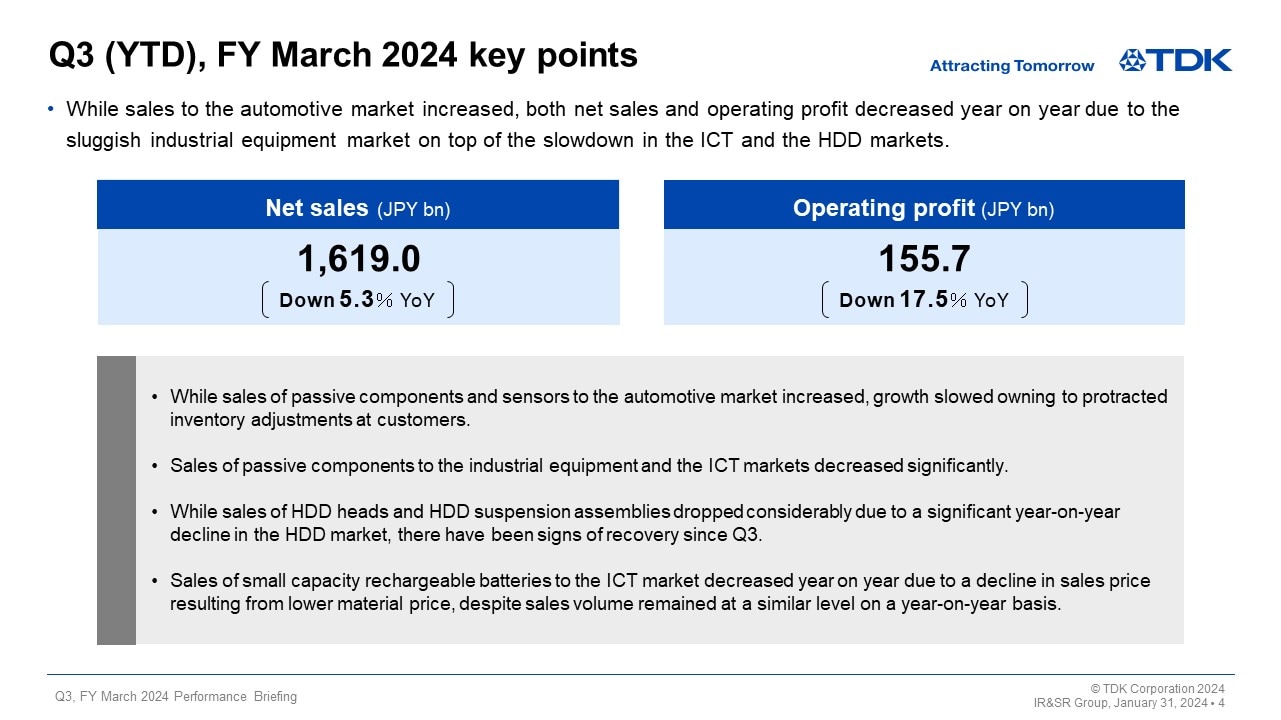
Looking at the global economy during the first nine months of fiscal 2024, while North America has remained firm, the sense of economic slowdown intensified due to the impact of unrest in the Middle East on top of the economic slowdown in Europe and China. Looking at foreign exchange rates, the depreciation of the yen continued, especially against the U.S. dollar and the euro.
Under such an operating environment, in the electronics market—which has a large bearing on the consolidated performance of TDK—capital investment demand remained generally weak in the industrial equipment market, while the prolonged slump in final demand resulted in sluggish ICT and HDD market demand. In the automotive market, on the other hand, production volume of xEVs and other automobiles increased from the previous year.
However, component demand was lower than TDK’s initial forecast due to protracted component inventory adjustments at some customers. As a result, net sales were down 5.3% year on year, and operating profit fell by 17.5% year on year.
Looking at sales in each business by market, sales of passive components to the industrial equipment and ICT markets decreased significantly. While sales of passive components and sensors to the automotive market increased, growth slowed due to protracted inventory adjustments at customers. While sales of HDD heads and HDD suspension assemblies dropped considerably due to a significant year-on-year decline in demand from the HDD market, there have been signs of a recovery since the third quarter. Sales of small capacity rechargeable batteries to the ICT market decreased year on year due to a decline in sales price resulting from lower material prices, despite sales volume remaining virtually unchanged on a year-on-year basis.
Q3 YTD, FY March 2024 results
Next, I would like to present an overview of the results in the third quarter on a YTD basis.
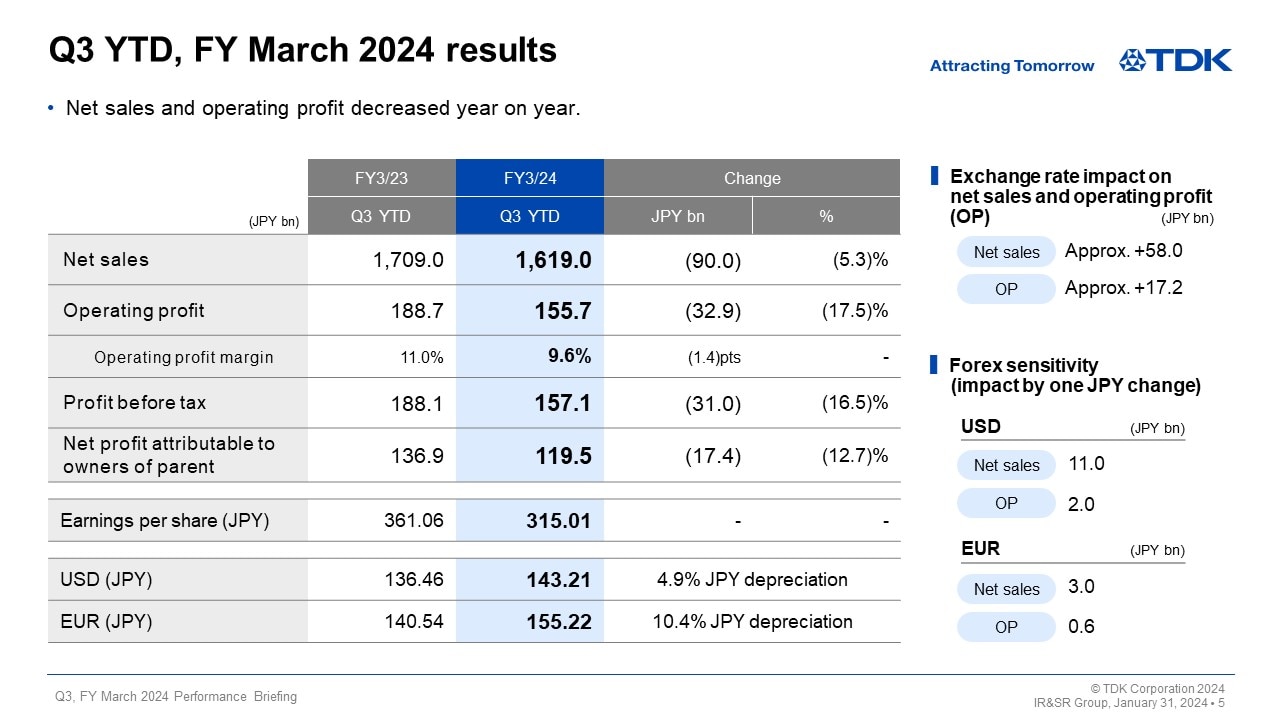
Due to exchange rate fluctuations against the U.S. dollar and other currencies, there was an increase of about 58.0 billion yen in net sales and an increase of about 17.2 billion yen in operating profit. Including this impact on operating profit, net sales were 1,619.0 billion yen, a decrease of 90.0 billion yen, or 5.3%, year on year. Operating profit was 155.7 billion yen, a decrease of 32.9 billion yen, or 17.5%, year on year. Profit before tax was 157.1 billion yen, and net profit attributable to owners of parent was 119.5 billion yen. Earnings per share were 315.01 yen.
With regard to exchange rate sensitivity, we maintain our estimate that a change of one yen against the U.S. dollar will affect operating income by about 2.0 billion yen a year, while a one-yen change against the euro will have an impact of about 0.6 billion yen a year.
Q3, FY March 2024 results
Next, I would like to present an overview of our consolidated results for the third quarter (three months) of fiscal 2024.
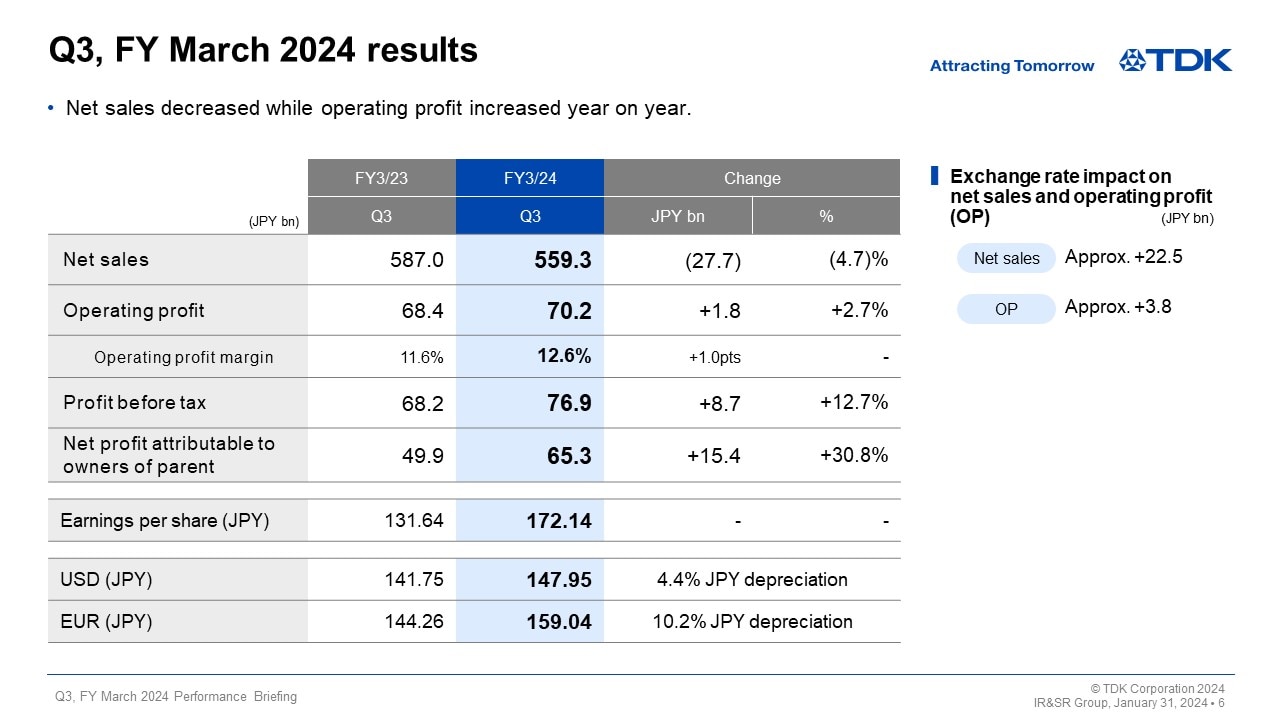
Due to exchange rate fluctuations against the U.S. dollar and other currencies, there was an increase of about 22.5 billion yen in net sales and an increase of about 3.8 billion yen in operating profit. Including this impact on operating profit, net sales were 559.3 billion yen, a decrease of 27.7 billion yen, or 4.7%, year on year. On the other hand, operating profit was 70.2 billion yen, an increase of 1.8 billion yen, or 2.7%, year on year. Profit before tax was 76.9 billion yen, and net profit attributable to owners of parent was 65.3 billion yen, up 30.8% year on year. Earnings per share were 172.14 yen.
Passive Components segment – Q3 YTD
Next, I would like to explain our business segment performance in the third quarter on a YTD basis.
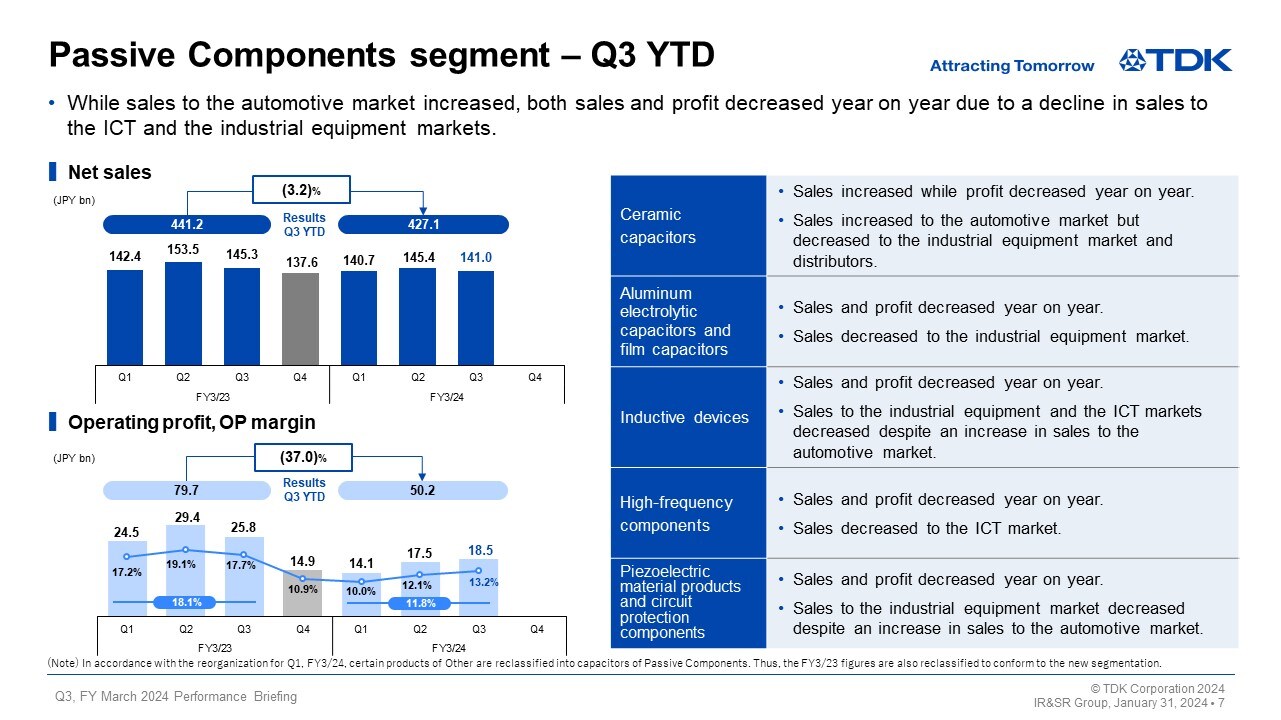
Net sales in the Passive Components segment were 427.1 billion yen, a decrease of 3.2% year on year. Operating profit was 50.2 billion yen, down 37.0% year on year, due to a decline in sales to the ICT and industrial equipment markets, despite an increase in sales to the automotive market, especially for sales related to xEVs.
While sales to the automotive market increased across all businesses, performance in each business varied due to the difference in amount of orders from other markets and by application.
While sales of ceramic capacitors increased year on year, driven by a rise in sales to the automotive market, profit decreased year on year due mainly to the deterioration in the product mix. Sales and profits of aluminum electrolytic capacitors and film capacitors decreased year on year, reflecting demand slowdown in the industrial equipment market. Sales and profits of inductive devices, piezoelectric material products, and circuit protection components decreased year on year due to a decline in demand from the ICT and industrial equipment markets as well as for home appliances and gaming applications. Sales and profits of high-frequency components dropped year on year owning to a decline in sales to the ICT market.
Sensor Application Products segment – Q3 YTD
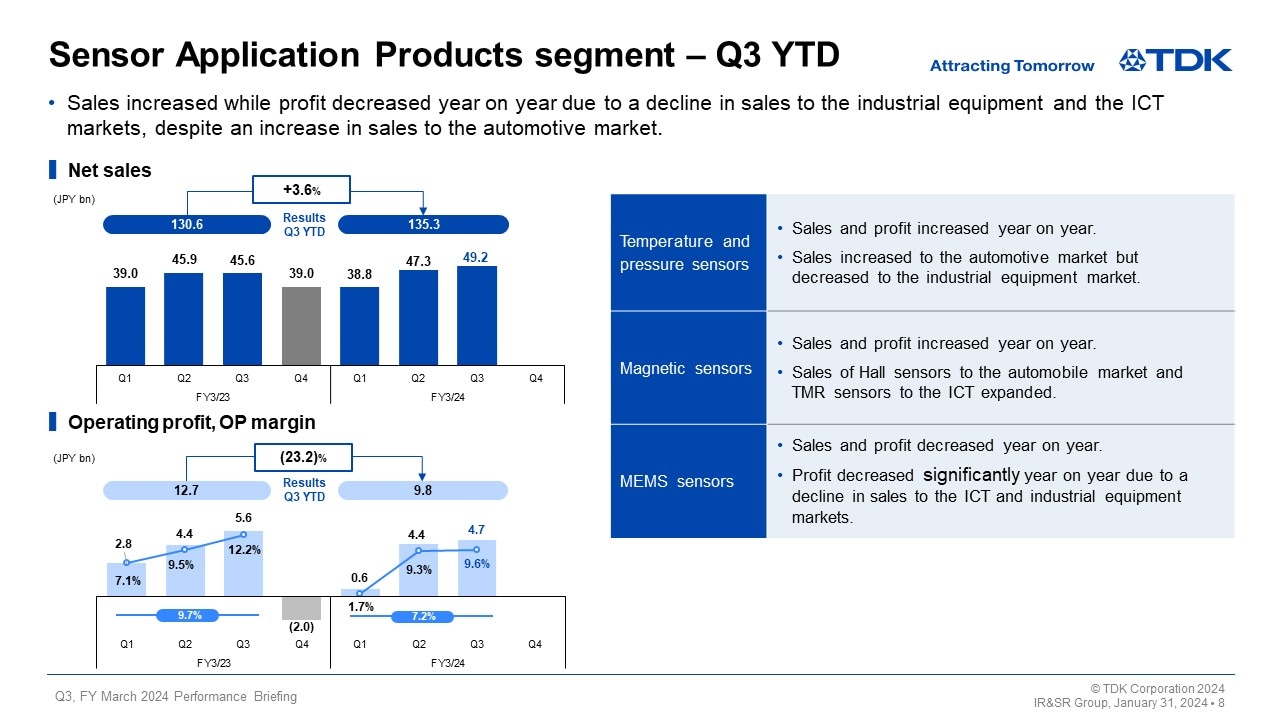
In the Sensor Application Products segment, net sales increased 3.6% year on year to 135.3 billion yen, while operating profit decreased 23.2% year on year to 9.8 billion yen.
Sales and profits of temperature and pressure sensors increased year on year, reflecting a rise in sales to the automotive market, despite a drop in sales to the industrial equipment market and for home appliances. Sales and profits of magnetic sensors increased year on year as sales of Hall sensors increased to the automotive market and sales of TMR sensors for smartphone applications remained brisk.
Sales and profits of MEMS sensors decreased year on year due to a drop in sales to the ICT and industrial equipment markets, despite an expansion in sales of motion sensors to the automotive market.
Magnetic Application Products segment – Q3 YTD
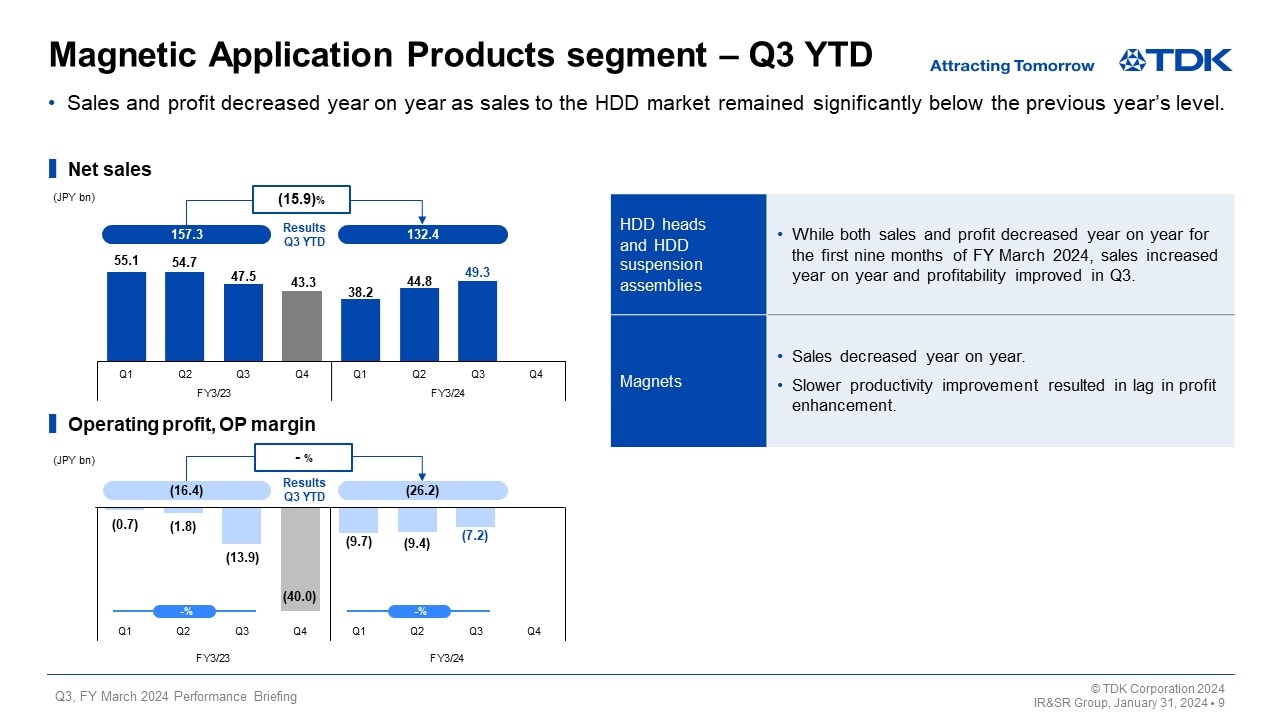
In the Magnetic Application Products segment, net sales fell 15.9% year on year to 132.4 billion yen, posting an operating loss of 26.2 billion yen.
In HDD heads and HDD suspension assemblies, total demand for HDDs decreased 24% year on year as HDD-related demand remained sluggish. In particular, total demand for nearline HDDs declined 35% year on year. As a result, sales of HDD heads and HDD suspension assemblies dropped significantly year on year, reflecting a substantial year-on-year decline in sales volume. This resulted in an increase in losses as well. Restructuring aimed at optimizing production systems has been implemented as scheduled and restructuring costs of about 1.9 billion yen were posted for the first nine months of fiscal 2024.
Sales of magnets decreased year on year, reflecting a decline in sales mainly to the industrial equipment market. In addition, lags in productivity improvements resulted in a slight increase in losses.
Energy Application Products segment – Q3 YTD
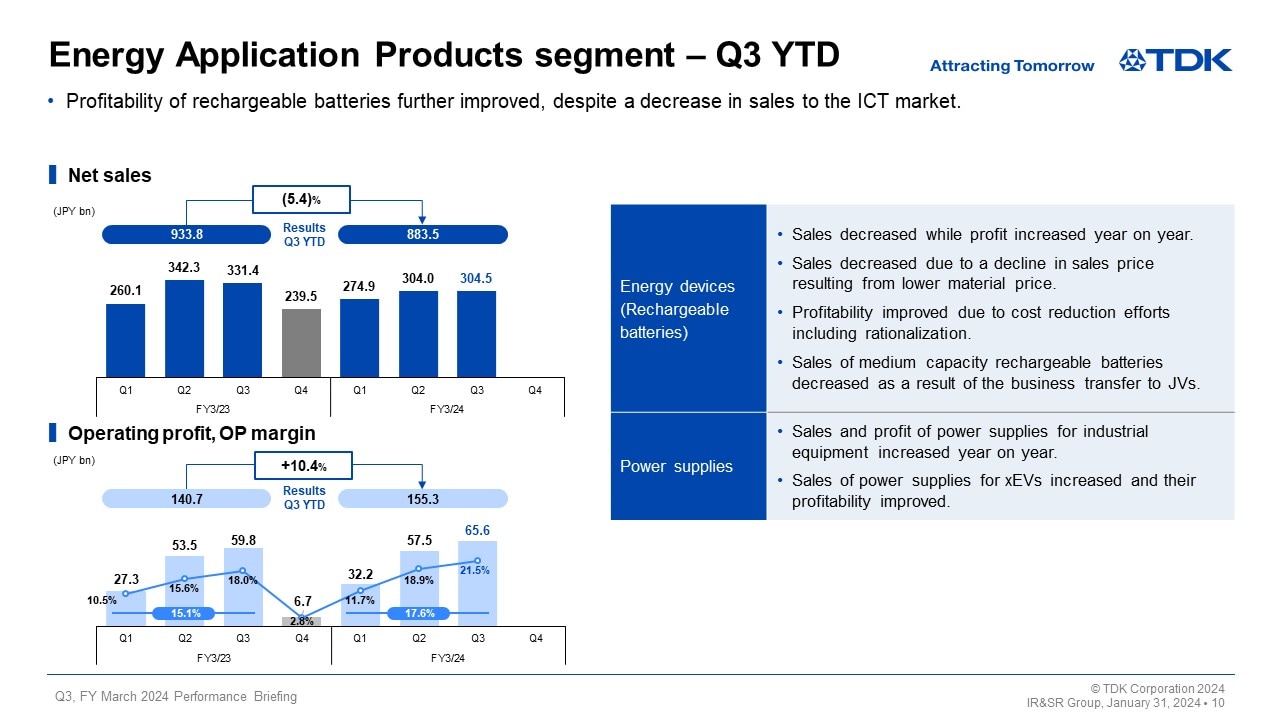
In the Energy Application Products segment, net sales decreased 5.4% year on year to 883.5 billion yen, while operating profit rose 10.4% year on year to 155.3 billion yen.
In rechargeable batteries, sales decreased year on year due to a decline in sales prices and discounts on selling prices resulting from lower material prices, despite an increase in the sales volume of small capacity rechargeable batteries for smartphone applications. Sales of energy devices on the whole decreased year on year due to a decline in sales of medium capacity rechargeable batteries as a result of the progress in business transfers to JVs. On the other hand, an increase in profit was achieved on a year-on-year basis due mainly to the effect of an increase in sales volume, rationalization and gains from exchange rate fluctuation.
In power supplies for industrial equipment, sales increased for industrial equipment applications—such as semiconductor manufacturing equipment—as well as for medical equipment applications, due to sales related to outstanding orders, resulting in year-on-year increases in both sales and profits. In power supplies for EVs, losses diminished considerably reflecting the benefits from restructuring at the end of the previous fiscal year on top of a year-on-year increase in sales.
Analysis of change in operating profit – Q3
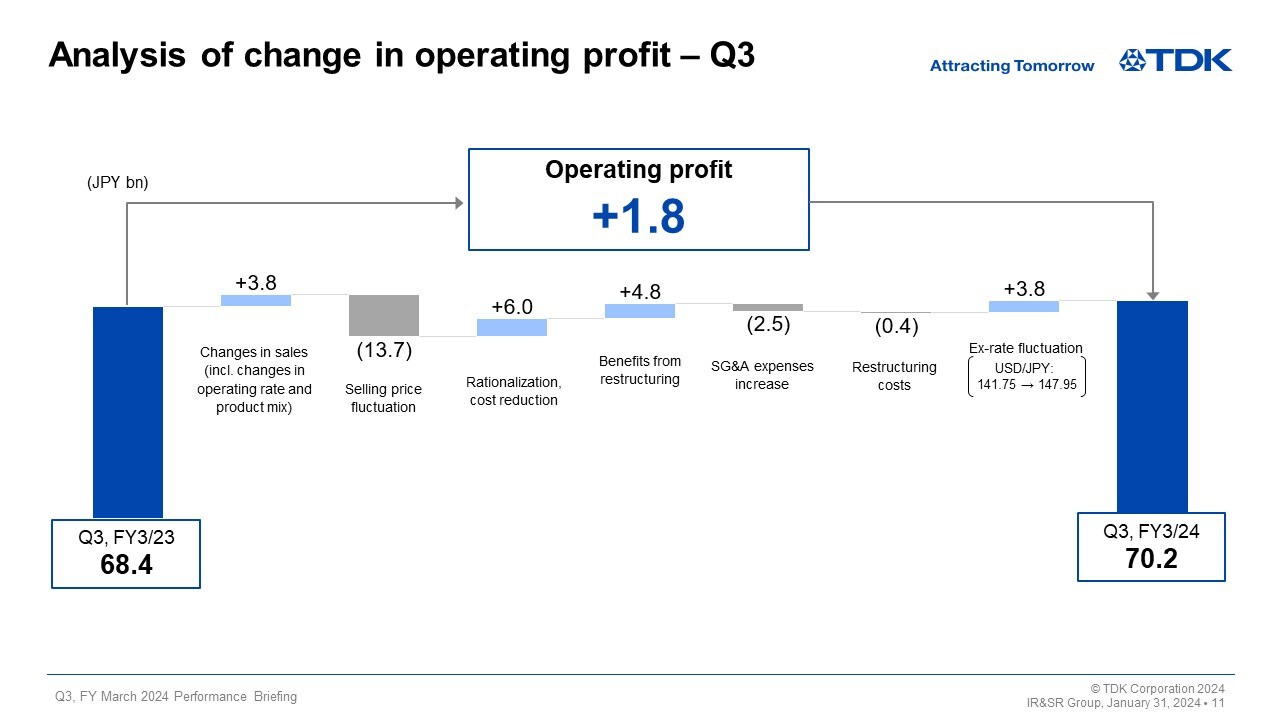
Operating profit increased 1.8 billion yen year on year for the third quarter of fiscal 2024. Let’s take a look at the main factors behind this. First, operating profit grew 3.8 billion yen year on year due to changes in sales, reflecting a year-on-year increase in profit from rechargeable batteries with a rise in sales volume, despite a year-on-year decrease in profit from passive components influenced by the effects of a decline in sales volume in addition to deterioration in the product mix and a lower operation rate. There was also an increase in profit totaling 10.8 billion yen due to rationalization and cost reduction efforts as well as benefits from restructuring, which nearly offset a decrease in profits of 13.7 billion yen due to selling price fluctuations.
SG&A expenses increased 2.5 billion yen due to an increase in the sales volume of rechargeable batteries and a rise in new product development costs. Restructuring costs increased by 0.4 billion yen. While restructuring costs related to HDD heads of 0.9 billion yen have been posted in both the previous and current fiscal years, this year-on-year increase reflected the recording of additional restructuring costs of 0.4 billion yen in tandem with the termination of legacy products in inductive devices. On the other hand, these negative effects on profit were mostly offset by an increase in profit of 3.8 billion yen due to exchange rate fluctuations reflecting the depreciation of the yen. As a result, operating profit increased 1.8 billion yen year on year on the whole.
Quarterly results by segment
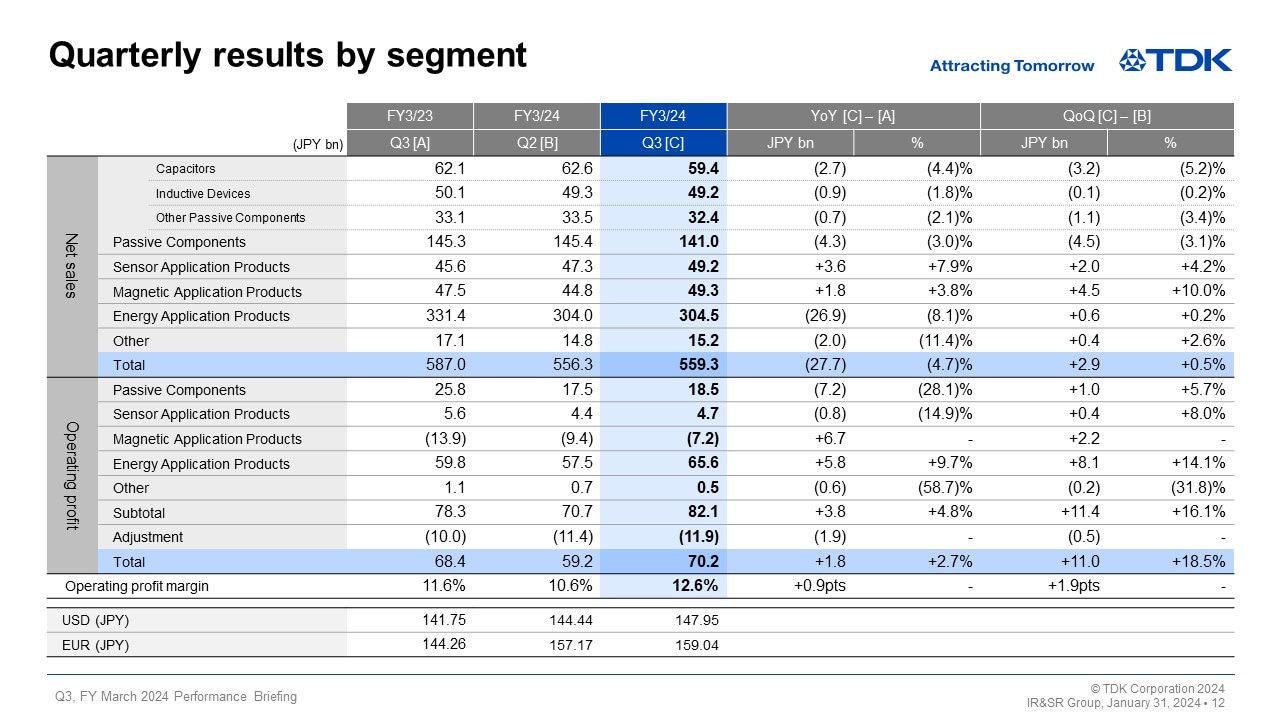
Now, I will explain some of the factors behind the changes in segment net sales and operating profit from the second quarter to the third quarter of fiscal 2024.
In the Passive Components segment, net sales decreased by 4.5 billion yen, or 3.1%, from the second quarter, while operating income increased by 1.0 billion yen, or 5.7%, from the second quarter. Sales and profits of ceramic capacitors increased from the second quarter, reflecting an increase in sales to the automotive market. Sales and profits of aluminum electrolytic capacitors and film capacitors decreased from the second quarter due to a decline in demand from the industrial equipment market. Sales of inductive devices remained virtually unchanged from the second quarter due to a decline in sales to the industrial equipment market, while profit increased from the second quarter, reflecting an increase in sales to the automotive and ICT markets, despite the negative impact of restructuring costs of 0.4 billion yen in tandem with the termination of legacy products. Sales and profits of high-frequency components increased from the second quarter due to an increase in sales to the ICT market, while sales of piezoelectric material products and circuit protection components decreased from the second quarter across all markets, resulting in a slight quarter-on-quarter decline in profit.
In the Sensor Application Products segment, net sales increased by 2.0 billion yen from the second quarter, and operating profit rose by 0.4 billion yen from the second quarter. Sales of temperature and pressure sensors increased from the second quarter due to an increase in sales to the automotive market. Sales and profits of magnetic sensors remained virtually unchanged from the second quarter, reflecting a rise in sales to the automotive market, despite a slight decline in sales as demand from the ICT market passed its peak. Sales of MEMS sensors increased from the second quarter, due mainly to a rise in the sales volume of motion sensors for smartphone applications in China.
In the Magnetic Application Products segment, net sales increased by 4.5 billion yen, or 10.0%, from the second quarter, and operating profit rose by 2.2 billion yen from the second quarter as operating loss diminished. Total demand for nearline HDDs bottomed out in the second quarter, and signs of a sales recovery have been seen from the third quarter. As the sales volume of HDD heads grew 14% from the second quarter and the sales volume of suspension assemblies rose about 1% from the second quarter, sales of HDD heads on the whole increased from the second quarter and operating loss diminished. As restructuring costs of 0.9 billion yen were recorded both in the second and third quarters, there was no change in the amount from the second quarter. Both sales and the operating profit of magnets remained virtually unchanged from the second quarter.
In the Energy Application Products segment, net sales increased by 0.6 billion yen, and operating profit surged by 8.1 billion yen from the second quarter. Both sales and profits of rechargeable batteries increased on the whole from the second quarter as sales of small capacity rechargeable batteries increased for smartphone applications in China, despite a decline in sales of medium capacity rechargeable batteries as a result of the business transfers to JVs. Sales of power supplies for industrial equipment remained robust. Both sales and profits of power supplies for EVs decreased from the second quarter.
Cash flows – Q3 YTD
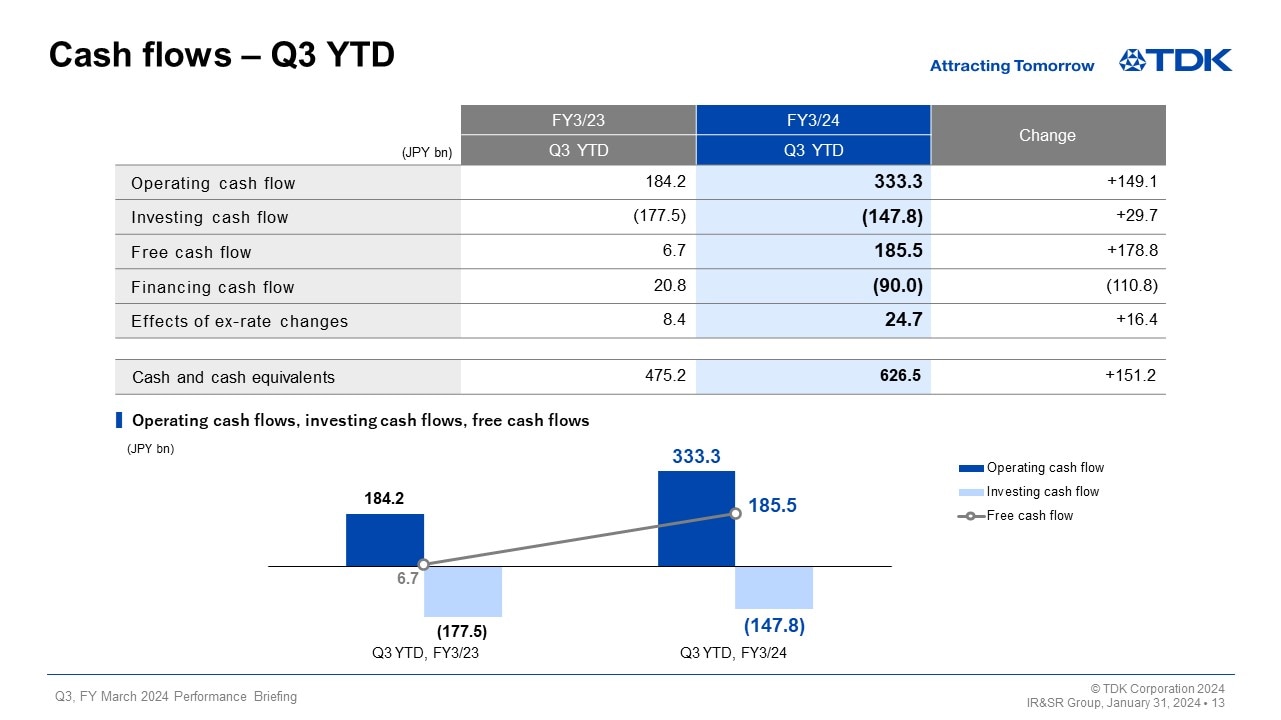
Next, I would like to present an overview of cash flows.
In the third quarter on a YTD basis (the first nine months of fiscal 2024), operating cash flow amounted to 333.3 billion yen, investing cash flow—such as capital expenditure—amounted to 147.8 billion yen, and free cash flow amounted to 185.5 billion yen. As in the first half of fiscal 2024, TDK continued efforts to further inventory optimization in light of market demand trends, and has been spending capital expenditure while carefully examining the demand-supply situation. As a result, free cash flow increased about 80.0 billion yen from the first half of fiscal 2024, due mainly to an increase in profit during the third quarter. TDK’s free cash flow has significantly exceeded the level of its initial cash flow projections for fiscal 2024 (80.0 billion yen). We will continue to work on inventory optimization and examination of capital expenditure in the fourth quarter.
Projections by segment for Q4, FY March 2024
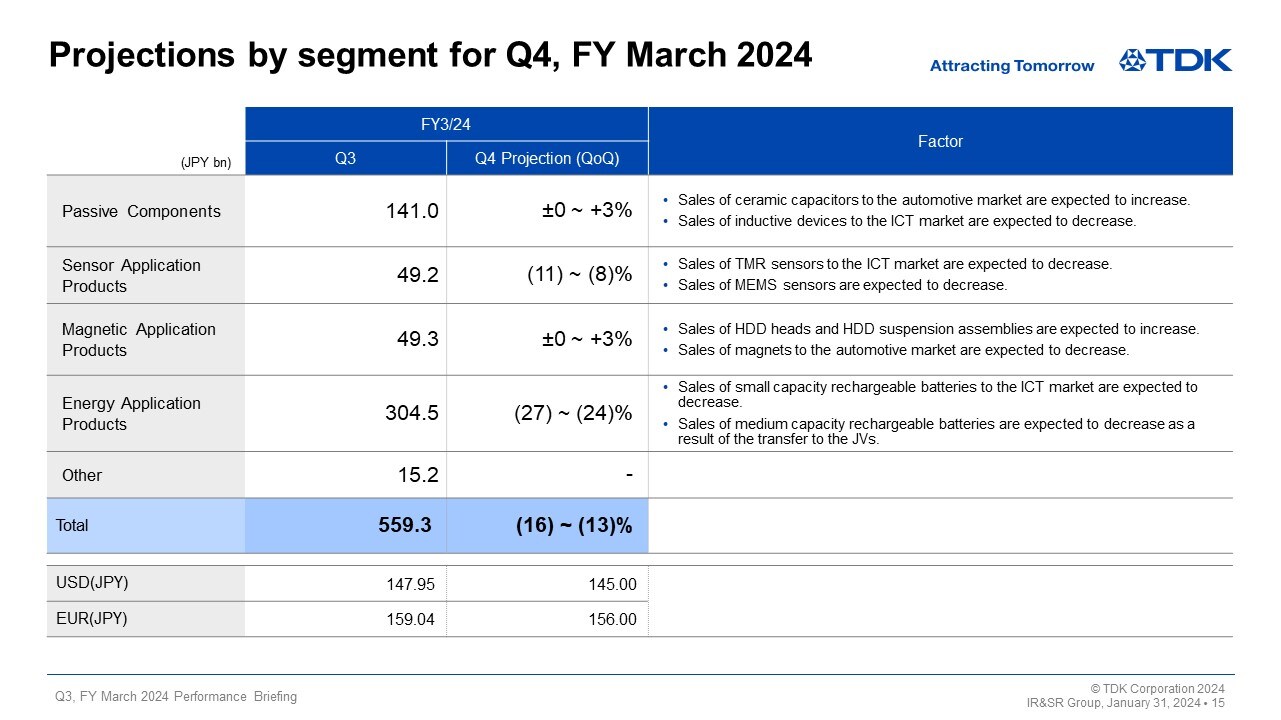
I would like to go over our full-year projections for the fiscal year ending March 2024.
Now, I would like to discuss our projection regarding changes in net sales by segment from the third quarter to the fourth quarter of fiscal 2024. Our exchange rate assumption for the fourth quarter is 145 yen against the U.S. dollar, and we expect virtually no impact due to exchange rate fluctuations from the third quarter.
In the Passive Components segment, sales of ceramic capacitors are expected to increase to the automotive market. Sales of inductive devices are anticipated to decrease due mainly to a decline in demand from the ICT market, reflecting seasonal factors. As a result, sales of Passive Components on the whole are forecast to increase by ±0–3% on a quarter-on-quarter basis.
In the Sensor Application Products segment, demand from the ICT market is expected to decrease due to seasonal factors. It is anticipated that sales of TMR sensors will decline and that sales of MEMS motion sensors and MEMS microphones will drop in the ICT market as well as for gaming applications. As a result, sales of Sensor Application Products on the whole are forecast to decrease by 11–8% on a quarter-on-quarter basis.
In the Magnetic Application Products segment, total demand for HDD heads are expected to decrease by about 6%. Total demand for nearline HDDs is predicted to increase by about 9% as there have been signs of a rebound. The sales volume of HDD heads and HDD suspension assemblies is anticipated to grow by about 10%. Sales of magnets to the automotive market are expected to decrease, and sales of Magnetic Application Products on the whole are forecast to increase by ±0–3% on a quarter-on-quarter basis.
In the Energy Application Products segment, the sales volume of small capacity rechargeable batteries is predicted to drop significantly, reflecting a decline in demand from the ICT market due to seasonal factors. The business transfer of medium capacity rechargeable batteries is also expected to progress. As a result, sales of Energy Application Products on the whole are forecast to decrease by 27–24% on a quarter-on-quarter basis.
Based on the above, we predict that total sales across all segments will decrease by 16–13% on a quarter-on-quarter basis.
FY March 2024 projections
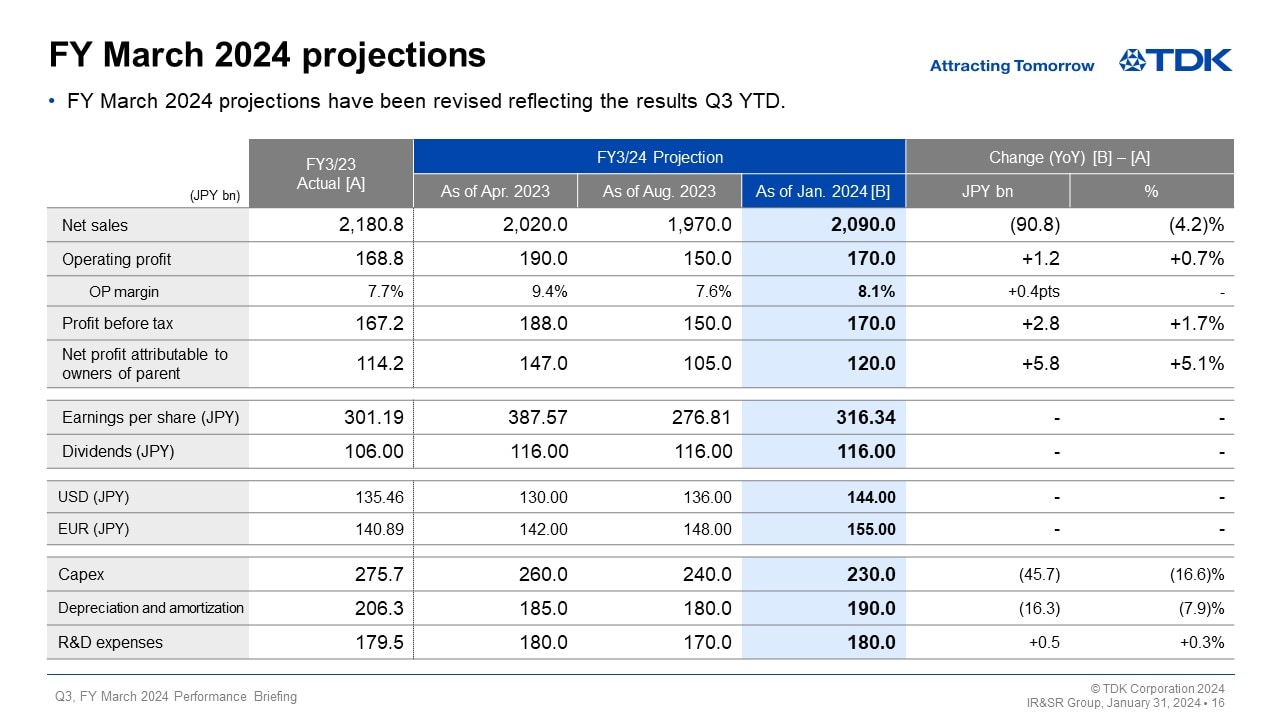
Next, I would like to go over our full-year projections.
During the first nine months of fiscal 2024, production in the electronics market on the whole slowed due to weakness in final demand. On the other hand, sales of small capacity rechargeable batteries increased more than expected during the third quarter under review, driven by the rebound of demand from the Chinese smartphone market in addition to the effect of the depreciation of the yen. Sales of HDD heads and HDD suspension assemblies remained above the predicted level. As a result, TDK’s performance for the first nine months of fiscal 2024 exceeded the projections held on August 2, 2023.
Under such circumstances, TDK has revised upward its consolidated projections for fiscal 2024 from the projections announced on August 2, 2023, as follows: net sales of 2,090.0 billion yen, operating profit of 170.0 billion yen, and net profit attributable to owners of parent of 120.0 billion yen. Our exchange rate assumption for the fourth quarter has been revised from the previous projection of 130 yen to 145 yen against the U.S. dollar. TDK will implement measures to enhance asset efficiency, looking ahead of the changes in future demand trends, and recognize one-time expenses including restructuring costs of approximately 12.0 billion yen in the fourth quarter of fiscal 2024.
We have kept our initial dividend forecast unchanged.
As a result of our careful examination of demand trends including a review of the timing to implement capital expenditure (Capex), we have revised our Capex projection to 230.0 billion yen, a decrease of 10.0 billion yen from the projection held on August 2, 2023. We have increased the projections for depreciation and amortization as well as R&D expenses by 10.0 billion yen, respectively, given the forecasted rise in expenses due to the depreciation of the yen against the U.S. dollar for the second half of fiscal 2024.
This concludes my presentation. Thank you very much for your attention.


