[ Financial Results for Fiscal 2015 Performance Briefing ]Consolidated Results for FY March 2015
Mr. Takakazu Momozuka
Corporate Officer
Hello. My name is Takakazu Momozuka. I am a corporate officer at TDK. I thank you all for taking time out of your busy schedules to attend our FY March 2015 earnings results presentation. I would like to begin with a summary of our consolidated earnings results.
Highlights of the Operating Results for FY March 2015
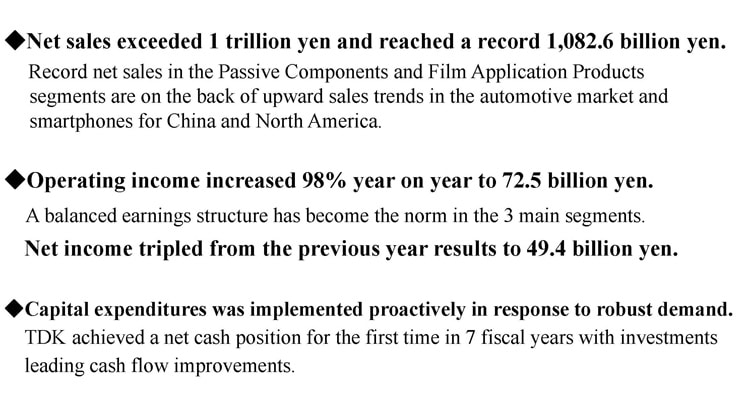
Our performance in the fiscal year ended March 31, 2015 was highlighted by record-high net sales of ¥1.0826 trillion, topping the ¥1 trillion mark for the first time. Sales were brisk in the automotive market and in the smartphone markets in China and North America. We booked all-time high sales in the passive components and film application products segments.
We registered operating income of ¥72.5 billion, a growth of 98% year-on-year. This reflects the well-balanced earnings structure in our three main segments. Our net income was ¥49.4 billion, which was triple the level we saw a year earlier. We implemented full-fledged capital expenditures in response to brisk market demand. Previously we also boosted our capital expenditure plans by ¥10.0 billion to ¥90.0 billion to meet demand for smartphones, mainly in the market in China. However, we anticipate smartphone demand is likely to remain strong, so we are boosting our capital expenditure plan by more than ¥10 billion to a total ¥102.5 billion. Moreover, this is the first time in seven fiscal years that we attained a net cash position, owing to improvements to cash flows despite ongoing investments.
Consolidated Full Year Results for FY March 2015
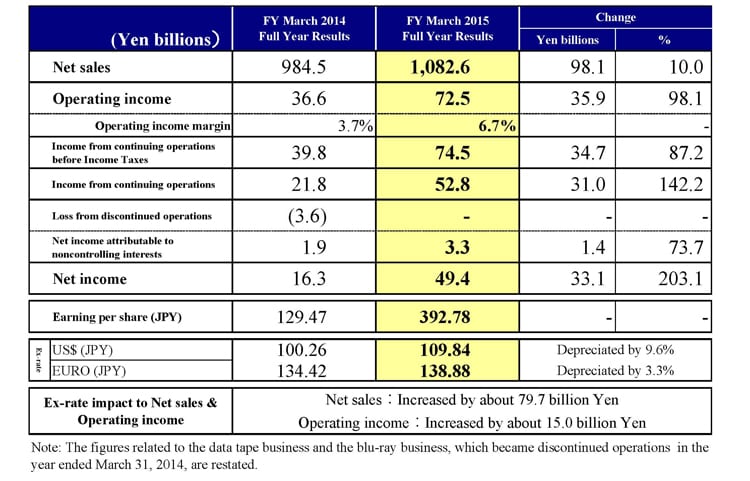
Here are the numerical results for FY March 2015. Net sales were ¥1.0826 trillion, a growth of ¥98.1 billion or 10% versus a year earlier. Operating income totaled ¥72.5 billion, an increase of ¥35.9 billion or 98.1% year-on-year. Our operating margin was 6.7%, an improvement of 3 basis points in comparison with the previous year. Meanwhile, income from continuing operations was ¥74.5 billion, a rise of ¥34.7 billion or 87.2%. And net income was ¥49.4 billion, an expansion of ¥33.1 billion or triple the level posted in FY March 2014. This is an EPS of ¥392.78. The average exchange rates for the fiscal year were ¥109.84 to the US dollar, a 9.6% decline in the yen’s value year-on-year, and ¥138.88 versus the euro, which was a 3.3% reduction in value. Based on these average foreign exchange rates, we posted a benefit to sales of roughly ¥79.7 billion and a benefit to operating income of around ¥15.0 billion. As we previously explained, our forex sensitivity for every ¥1 decline in the yen’s value against the US dollar is a gain of about ¥1.4 billion. As for the euro, the impact remains minimal.
FY March 2015 Results - Passive Components Segment
111657014Let’s move on to our segment performance. First, in the passive components segment, we booked sales of ¥541.2 billion, a growth of 14.7% year-on-year, and operating income of ¥37.9 billion, an increase of 146.1%. The operating margin in this segment was 7%, increased from 3.3% in the previous year. Looking at performance in each of the major product categories in this segment, sales and profit were up in the ceramic capacitors business driven by strong sales to the automotive industry. Profit margin also improved thanks to a boost to productivity. In the inductive devices business, sales and profit rose owing both to a substantial increase in sales to smartphone customers in North America and China, and an increase in sales to the automotive industry. In addition, sharp profit growth reflected an improvement in product mix. In the high-frequency components business, sales and profit increased. In addition to benefit from a growth in the LTE smartphone market in North America and China, sales were also brisk to the ICT market. In particular, sales of discrete products were favorable. There was also benefit from an improvement in productivity. In the piezoelectric material products, sales and profits also rose as we enjoyed an increase in sales of VCMs for automotive parts and camera modules.
FY March 2015 Results - Magnetic Application Segment
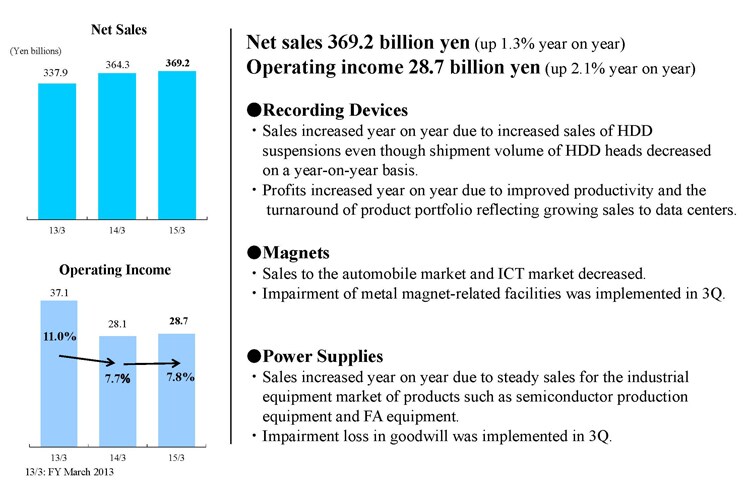
In the magnetic application segment, we posted sales of ¥369.2 billion, an increase of 1.3% year-on-year, and operating income of ¥28.7 billion, an expansion of 2.1%. We achieved an operating margin in this segment of 7.8%, which was on a par with the previous year. In the recording devices business, although shipment volume for HDD heads declined, sales of HDD suspensions increased, buoying overall sales in this business. Profit growth was underpinned by enhanced productivity, reduced fixed cost, and an improvement in product mix—the latter reflecting the start of an upturn in sales to data centers. In the magnets business, sales to the automotive industry and ICT market decreased due to ongoing poor performance. In 3Q, we posted an impairment loss of around ¥3.1 billion for metal-magnet related facilities. Going forward, we plan to accelerate improvements by focusing management resources into the automotive and industrial equipment markets. In the power supplies business, sales increase reflecting stable demand from the industrial equipment market, for use in products such as semiconductor production equipment and factory automation equipment. In 3Q, we posted an impairment loss on goodwill of ¥2.2 billion.
FY March 2014 Results - Film Application Segment
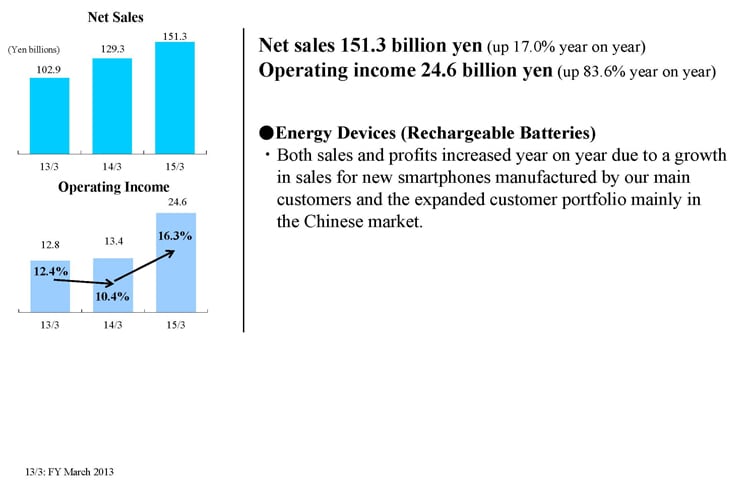
Moving on the film application segment, we posted sales of ¥151.3 billion, a growth of 17% year-on-year, and operating income of ¥24.6 billion, a rise of 83.6%. The segment operating margin improved substantially to 16.3%, versus 10.4% in the previous year. This mainly reflects performance in the rechargeable batteries (energy devices) business which benefited from brisk sales of new smartphones at major customers. Rechargeable battery shipments tended to decline in 4Q. However, owing to expectations that demand will remain brisk, the decline in rechargeable battery shipments was minimal. Consequently, we posted a substantial growth in sales and profit in the energy devices business reflecting the performance of our rechargeable batteries and owing to an expansion in our customer portfolio, mainly in the market in China.
FY March 2015 results by Segment
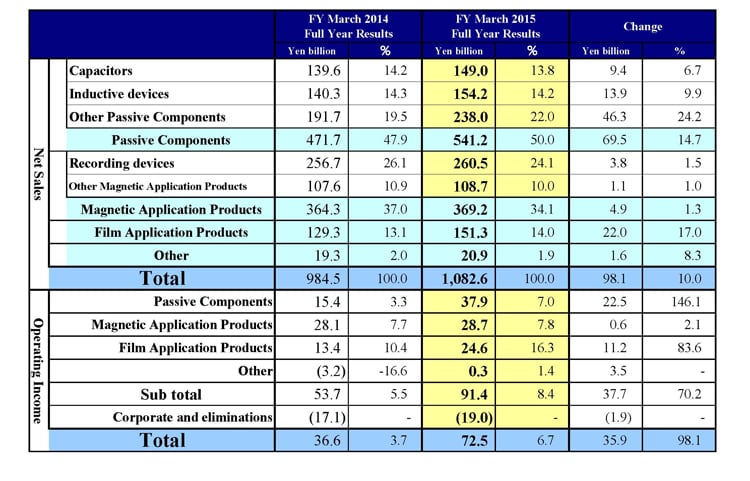
In the other segment, we booked sales of ¥20.9 billion, an increase of ¥1.6 billion or 8.3% year-on-year. In addition, we achieved operating income of ¥300 million, an improvement from an operating loss of ¥3.2 billion in the previous year. This largely reflects an improvement in profit margins in new businesses. In corporate and eliminations, our loss grew from ¥17.1 billion in the previous year to ¥19.0 billion. This was due to an increase in R&D and system-related costs.
Breakdown of Operating Income Changes
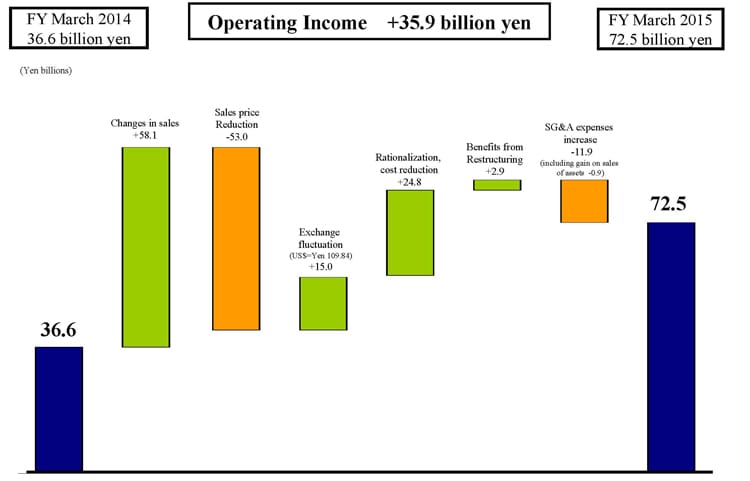
Next let’s look at the factors that positively and negatively impacted our operating income. Sales growth, which includes operating rate and product mix, boosted profit by around ¥58.1 billion. In particular, profit was bolstered by sales of passive components which were brisk throughout the year owing to demand for automotive and ICT applications, as well as a substantial increase in sales of rechargeable batteries to smartphone manufacturers. Another profit growth catalyst was the improvement in product mix owing to a growth in sales of HDD heads to data centers.
The next factor was the decline in selling prices. This detracted from profit growth by around ¥53.0 billion. In contrast, the gain from forex translations owing to benefit from a weaker yen pushed up profit by around ¥15.0 billion. In addition, we continued to implement rationalization cost reductions to absorb the rise in the wage rate, labor costs, and raw materials costs. An improvement in productivity, mainly in HDD heads and passive components, and progress in rationalization also offset negatives. Accordingly, this had a positive overall impact on profit growth of around ¥24.8 billion. The benefit to profit growth from structural reform benefits was approximately ¥2.9 billion. Meanwhile, the rise in SG&A costs, which factors in the previous year’s increase in gain on asset sales of ¥900 million, detracted from profit growth by around ¥11.9 billion.
FY March 2015 Quarterly Results by Segment
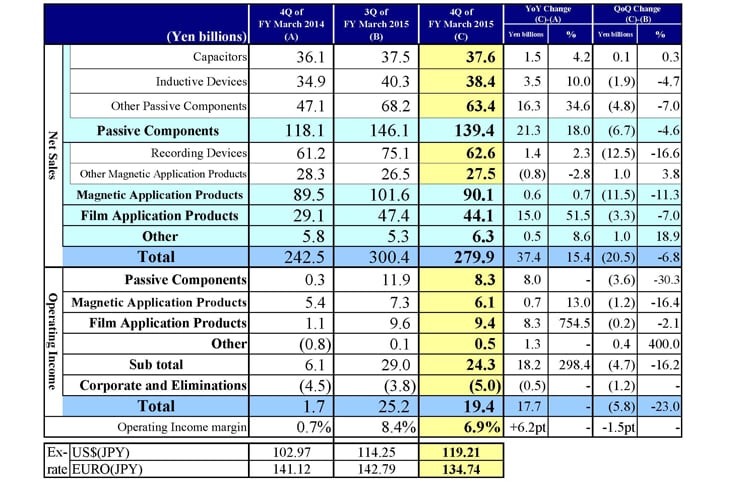
I would next like to discuss the change in sales and profit trends between 3Q and 4Q. In 4Q, we booked net sales of ¥279.9 billion, a decline of ¥20.5 billion or 6.8% quarter-on-quarter from the ¥300.4 billion in 3Q. Meanwhile, operating income in 4Q was ¥19.4, a decrease of ¥5.8 billion from the ¥25.2 billion we booked in 3Q. Looking at segment performance, 4Q sales in the passive components segment was ¥139.4 billion, a fall of ¥6.7 billion or 4.6% versus the ¥146.1 billion we posted in 3Q. Sales of capacitors were nearly flat quarter-on-quarter, at ¥37.6 billion in 4Q, up ¥100 million or 0.3%. Demand remained stable from the automotive and industrial equipment industries.
Sales of inductive devices in 4Q totaled ¥38.4 billion, a decline of ¥1.9 billion or 4.7% versus 3Q. This mainly reflects the impact from the Lunar New Year holiday in China which is in 4Q. Smartphone production declined in both China and North America quarter-on-quarter, which dragged down sales to ICT. Sales of other passive components came to ¥63.4 billion in 4Q, which was a decrease of ¥4.8 billion or 7% in contrast with 3Q. As for inductive devices, there was negative impact from the Lunar New Year holiday in China. Sales of high-frequency components and piezoelectric material products to smartphone manufacturers in China and North America were down.
In the passive components segment, 4Q operating income totaled ¥8.3 billion, a decline of ¥3.6 billion versus the ¥11.9 billion posted in 3Q. In addition, we posted ¥2.1 billion in restructuring costs in 4Q. Overall, despite stable sales to the automotive and industrial equipment industries, the decline in sales mainly to the ICT market due to the Lunar Chinese New Year holiday weighed down overall segment sales and profit. We also posted ¥400 million in goodwill expense for Epcos AG.
In the magnetic application products segment, we posted 4Q sales of ¥90.1 billion, which was a decrease of ¥11.5 billion or 11.3% versus the ¥101.6 billion we booked in 3Q. By product, we registered recording device sales of ¥62.6 billion in 4Q, a fall of ¥12.5 billion or 16.6% versus 3Q. In 3Q we saw brisk demand for recording devices but in 4Q HDD head shipments were lower than initially expected. This reflected inventory adjustments at HDD manufacturers. In addition, some of the product we shipped in 3Q was initially scheduled for 4Q. Meanwhile, shipments of HDD heads used in nearline storage devices at data centers were flat quarter-on-quarter. The shipment index for HDD heads in 3Q was previously anticipated to be 95 points, but was actually 90 points. Meanwhile, sales of other magnetic application products in 4Q totaled ¥27.5 billion, an increase of ¥1.0 billion or 3.8% from 3Q. Sales of power supplies increased to the industrial equipment and automotive industries. Meanwhile, 4Q operating income in the magnetic application products segment was ¥6.1 billion, a fall of ¥1.2 billion or 16.4% in comparison with the ¥7.3 billion booked in 3Q. This reflects a decline in profit from recording devices due to a decline in shipment volume for HDD heads.
In the film application products segment, we posted sales of ¥44.1 billion in 4Q, which was a decline of ¥3.3 billion or 7.0% versus the ¥47.4 billion in sales we booked in 3Q. Segment operating income in 4Q was ¥9.4 billion, a decrease of ¥200 million from 3Q operating income of ¥9.6 billion. A ¥2.2 billion gain on the partial sale of assets is factored into this operating income. As I discussed earlier, in general, production level at our main customers declines from 3Q to 4Q. However, this year that decline was marginal. In addition, we saw an increase in orders from new customers. In light of this, the quarter-on-quarter decrease in sales and operating income in this segment in 4Q was small.
In the other products segment, operating income increased ¥400 million to ¥500 million, underpinned by a ¥1.0 billion growth in sales. The negative impact to corporate and eliminations in 4Q was ¥5.0 billion, an increase of ¥1.2 billion from the negative impact of ¥3.8 billion we posted in 3Q. In 3Q, we posted a gain on land sales of ¥700 million to corporate and eliminations.
Financial Position
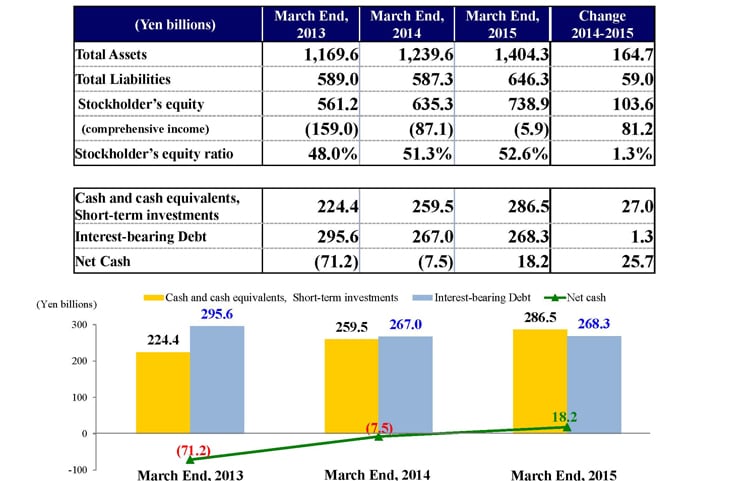
Next I would like to go over our financial position. As of March 31, 2015, total assets stood at ¥1.4043 trillion, an increase of ¥164.7 billion versus March 31, 2014. Total liabilities were ¥646.3 billion, an increase of ¥59.0 billion. Shareholder’s equity was ¥738.9 billion, an increase of ¥103.6 billion. Our comprehensive loss at the end of FY March 2015 was ¥5.9 billion, a decrease of ¥81.2 billion year on year form ¥87.1 billion. This is primarily attributable to an increase of ¥90.6 billion in the foreign currency exchange adjustment account owing to benefit from the substantial decline in the yen’s value in comparison with the previous fiscal year. Our shareholder’s equity ratio stood at 52.6%, an improvement of 1.3% year-on-year. Cash, cash equivalents, and short-term investments, plus investment securities totaled ¥286.5 billion, an increase of ¥27.0 billion. Meanwhile, interest-bearing liabilities were ¥268.3 billion, a rise of ¥1.3 billion. Accordingly, our net cash, after deducting interest-bearing liabilities from cash on hand was a positive ¥18.2 billion. All in all, in effect we are debt free, which was our goal for FY March 2015.
Free Cash Flow
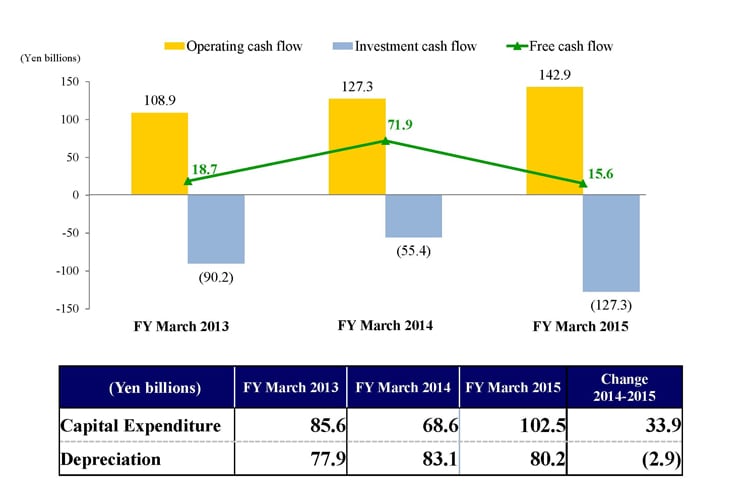
Lastly I would like to briefly discuss our free cash flow. Our free cash flow is ¥15.6 billion, after deducting our investment cash flow of ¥127.3 billion from our operating cash flow of ¥142.9 billion. Capital expenditures exceeded depreciation expense owing to our need to satisfy brisk demand in the ICT market. However, owing to the increase in net cash from operating activities, we secured a positive free cash flow. This ends my portion of our briefing on TDK’s consolidated earnings results for FY March 2015. Thank you very much.


