[ 1st Quarter of fiscal 2015 Performance Briefing ]Consolidated Results for 1Q of FY March 2015

Mr. Takakazu Momozuka
Corporate Officer
Hello, my name is Takakazu Momozuka. Thank you for attending this presentation today. I will be presenting TDK’s consolidated results for the first quarter of FY March 2015.
Key points concerning earnings for 1Q of FY March 2015
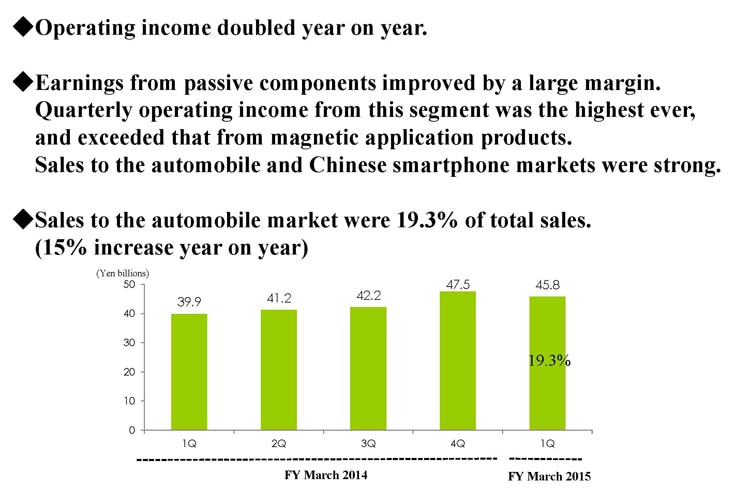
In terms of the key points, the first thing to note is that operating income doubled on a year-on-year basis. The profit increase was particularly large in the passive components business, which generated operating income of ¥7.8 billion. This was the highest quarterly figure ever, and better than the result for magnetic application products. It drove the overall Q1 performance. Sales were especially strong for automotive and Chinese smartphone applications. TDK’s automotive sales were 19.3% of the total, and grew 15% year on year.
Consolidated Results for 1Q of FY March 2015
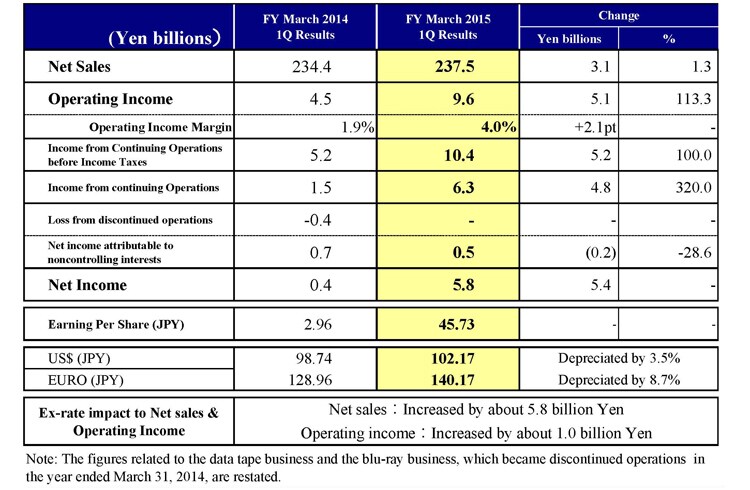
This slide gives an overview of the Q1 results. The data tape and Blu-ray businesses were discontinued operations in Q1 of FY March 2014, and the losses from a year earlier are restated here. Quarterly net sales of ¥237.5 billion were equivalent to growth of ¥3.1 billion, or 1.3% year on year. Operating income increased by ¥5.1 billion, or 110%, to ¥9.6 billion, and the operating income margin improved by 2.1 percentage points. Pre-tax income from continuing operations grew by ¥5.2 billion to ¥10.4 billion, while net income increased by ¥5.4 billion to ¥5.8 billion. Earnings per share were ¥45.73. In terms of the average exchange rates, the yen depreciated by 3.8% against the US dollar to ¥102.17, and by 8.7% to ¥140.17 against the euro. The net forex impact was an increase of about ¥5.8 billion in sales and ¥1.0 billion in operating income. As we have stated before, we estimate our US dollar forex sensitivity at approximately ¥1.4 billion per ¥1 movement for operating income.
1Q Results - Passive Components Segment
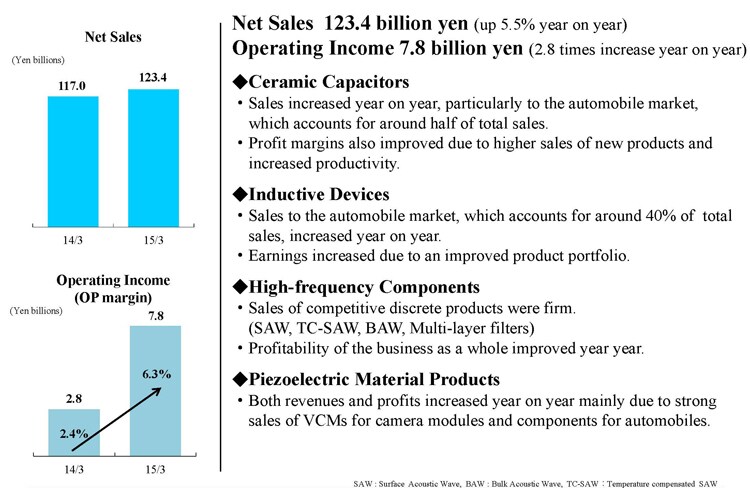
Moving on to business segment performance, net sales for the passive components segment increased 5.5% year on year to ¥123.4 billion. Operating income rose 180% to ¥7.8 billion. Sales were particularly strong for automotive and Chinese smartphone applications. Sales of ceramic capacitors benefited especially, since the automotive sector accounts for about half the demand for these products. Margins also improved due to higher sales of new products coupled with productivity gains.
We posted higher sales of inductive devices, where the automotive market generates about 40% of demand. Profits also increased due to the improved product mix.
In high-frequency components, we generated strong sales of discrete devices where TDK is competitive, led by China. This resulted in a substantial improvement in profits compared with Q1 of FY March 2014.
In piezoelectric material products, we booked higher revenues and profits due to increased sales of voice coil motors for camera modules used in Chinese smartphones, and of products for automotive applications.
1Q Results - Magnetic Application Segment
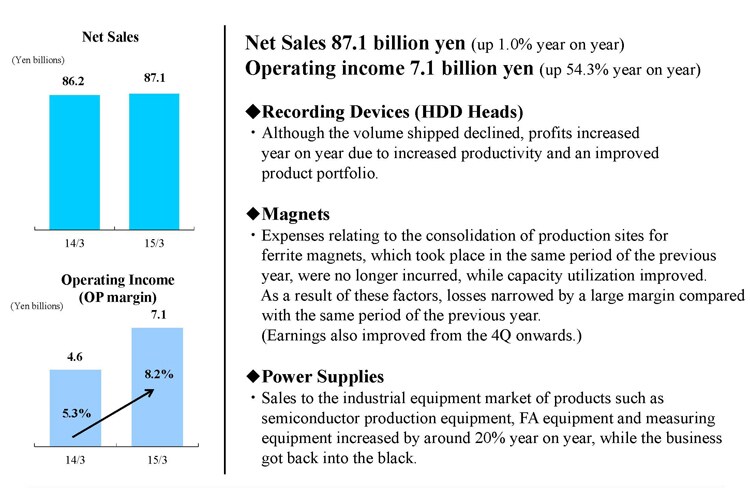
The magnetic application segment recorded a 1% increase in net sales to ¥87.1 billion and a 54.3% increase in operating income to ¥7.1 billion. In the recording devices business, we saw shipment volumes for HDD heads fall, but we were able to generate higher profits in year-on-year terms due to productivity gains, lower fixed costs, and a better product mix.
In our magnets business, which is in the news at the moment, the first quarter of last year featured significant charges for consolidation of production sites in China. The absence of these costs, plus higher capacity utilization, led to a significantly smaller loss in Q1. In the power supplies business, sales were up about 20% year on year to the SPE, FA equipment and industrial equipment sectors, enabling us to report a profit from these operations in Q1.
1Q Results - Film Application Segment
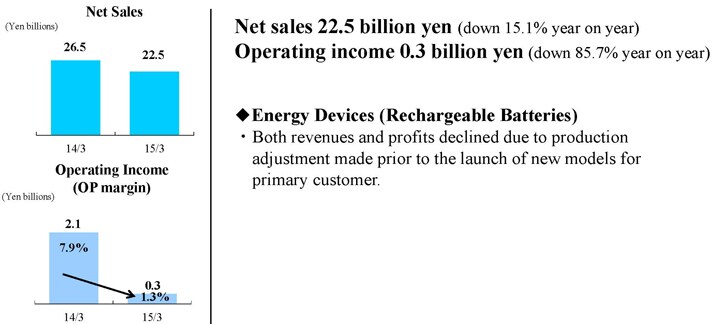
In the film application segment, which mostly consists of energy devices and rechargeable batteries, quarterly net sales declined 15.1% to ¥22.5 billion, while operating income fell 85.7% to ¥0.3 billion. The steep declines in revenue and profit were due to particular factors, notably adjustments to production at major customers prior to the launch of new models. Shipments of the new products began on schedule in July, and we are forecasting a substantial recovery in shipments during Q2.
Quarterly Results by Segment
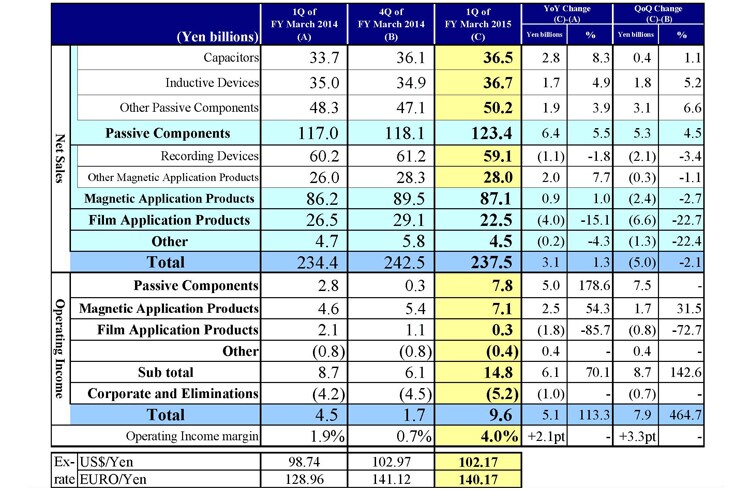
Besides the three main segments that I have just reviewed, this slide shows the results for other products. Net sales in this final segment fell by ¥0.2 billion, or 4.3% year on year, to ¥4.5 billion, and the operating loss improved from ¥0.8 billion to ¥0.4 billion. In corporate and eliminations, last year’s ¥4.2 billion loss widened to ¥5.2 billion. This reflected higher R&D expenses and investments in systems. We also booked restructuring charges of ¥0.3 billion in Q1, which was a drop of ¥0.4 billion compared with last year’s ¥0.7 billion figure.
Next I would like to discuss the changes in sales and operating income compared with the previous quarter, Q4 of FY March 2014. Total Q4 operating income of ¥1.7 billion included about ¥6.6 billion in restructuring charges for continuing operations.
By segment, the passive components segment recorded quarterly growth in net sales of ¥5.3 billion, or 4.5%. Sales of capacitors increased by ¥0.4 billion, or 1.1%, mostly due to sales for automotive and industrial equipment uses. Sales of inductive devices increased by ¥1.8 billion, or 5.2%, reflecting the significant increase in sales to the communications equipment market centered on Chinese smartphone manufacturers. Sales of other passive components increased by ¥3.1 billion, or 6.6%, from Q4. In the same manner as for inductance devices, there was high demand for high-frequency components, camera module VCMs and other parts used by Chinese smartphone makers. The passive components segment saw operating income jump by ¥7.5 billion, from ¥0.3 billion to ¥7.8 billion. This was partly due to restructuring charges of about ¥1.5 billion that were booked in Q4. Strong demand from the automotive and Chinese smartphone markets helped our capacity utilization recover across the board, boosting profits. Improved sales of discrete high-frequency components, which generate high margins, also provided a major boost.
The magnetic application products segment posted a decline in net sales compared with Q4 of ¥2.4 billion, or 2.7%. Sales of recording devices dropped by ¥2.1 billion, or 3.4%, with shipment volumes of HDD heads declining slightly due to end-of-period adjustments at hard disk drive manufacturers. Sales of other products in this segment were broadly flat. Conditions stayed buoyant in the automotive and industrial equipment sectors, the principal markets for our magnets and power supplies. Operating income in the magnetic application products segment increased 31.5%, or ¥1.7 billion, from ¥5.4 billion in Q4 to ¥7.1 billion in Q1. Partly this reflected the absence of restructuring charges of about ¥1.8 billion that we booked in Q4.
Net sales for the film application products segment declined by ¥6.6 billion, or 22.7%, compared with Q4. Sales of rechargeable batteries fell due to the impact of production adjustments at major customers ahead of the launch of new models. Segment operating income fell ¥0.8 billion, or 72.7%, from ¥1.1 billion to ¥0.3 billion. Please note the results for Q4 included restructuring charges of around ¥2.3 billion.
Breakdown of Operating Income Changes
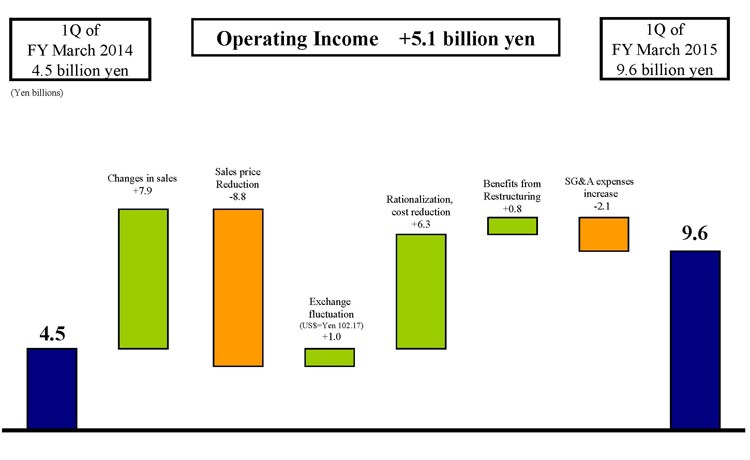
This next slide analyzes the year-on-year gain of ¥5.1 billion in quarterly operating income. First, changes in sales relating to capacity utilization and mix factors inflated earnings by about ¥7.9 billion. Product mix improved due to higher passive component sales in the automotive and Chinese smartphone sectors. Q1 earnings improved in year-on-year terms due to the capacity-lowering impact of the consolidation of Chinese magnet production bases dropping out. Sales price erosion led to a fall in profit of about ¥8.8 billion. Exchange rate fluctuations boosted earnings by roughly ¥1.0 billion. Hourly wage costs increased in China, but productivity gains for HDD heads, rationalization efforts and reduced material costs together inflated profits by around ¥6.3 billion. Restructuring delivered benefits worth about ¥0.8 billion. Finally, SG&A expenses increased by about ¥2.1 billion.
Sales Results by Priority Markets
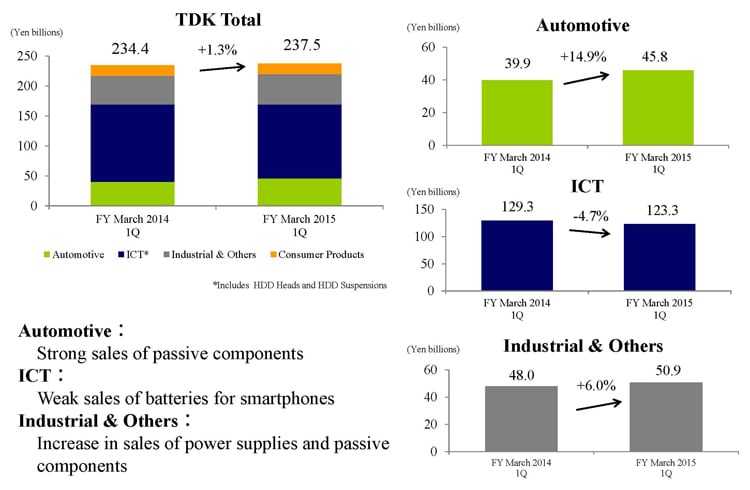
This next slide shows TDK’s sales to priority markets. In the automotive sector, our sales to markets in North America and China grew strongly in Q1, resulting in a 14.9% increase in sales year on year to ¥45.8 billion. The key contributor here was passive components, alongside growth from inductive devices, capacitors and other products. In ICT, we saw good sales of high-frequency components and inductive devices for Chinese smartphones, but our sales of rechargeable batteries to key customers were weak. This led to an overall 4.7% decline in ICT sector sales in Q1. In the Industrial & Others sector, sales rose around 6% due to higher sales of power supplies and passive components for industrial equipment.
Projections for 2Q of FY March 2015 -Image of change in sales
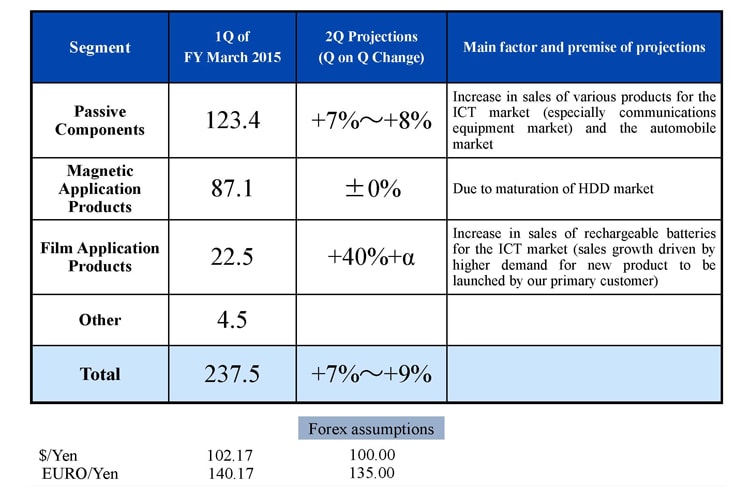
The next slide shows our sales projections by segment for the September quarter, namely Q2. In passive components, we expect another 7–8% increase over the Q1 figure of ¥123.4 billion, with growth coming from the ICT and automotive sectors. We expect magnetic application products segment sales to be flat compared with the Q1 figure of ¥87.1 billion, reflecting the maturity of the HDD market. In the film application products segment, we are forecasting a quarter-on-quarter increase of at least 40% with a significant increase in shipments, since the Q1 sales were unusually low at ¥22.5 billion. This mainly reflects the recovery in sales of rechargeable batteries for smartphones. Overall, we expect Q2 sales to be about 7–9% ahead of the Q1 total of ¥237.5 billion.
FY March 2015 Full Year / Dividend Projections
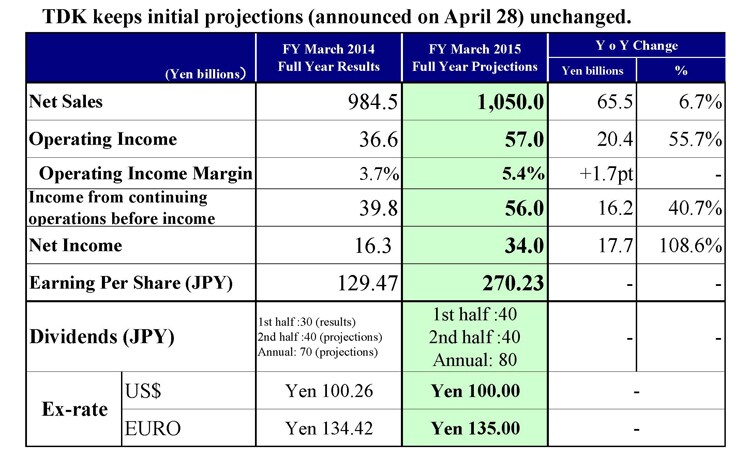
Finally, our consolidated full-year forecasts for FY March 2015 are unchanged from what we announced before. We are forecasting net sales of ¥1,050 billion, operating income of ¥57 billion, pre-tax income of ¥56 billion, and net income of ¥34 billion. I have just outlined our expectations for sales in Q2. In the second half, we expect more strong growth from the automotive sector and from orders for passive components by Chinese smartphone makers. In rechargeable batteries, we expect higher sales to Chinese customers, while expanding the business through new customers as well. Our assumed average exchange rates from Q2 onwards are ¥100 for the US dollar and ¥135 for the euro. That concludes my presentation. Thank you for your attention today.


