

Financial Results
Taking a broad overview of the electronics market, which has a bearing on the consolidated business results of TDK, the production of smartphones, which have been experiencing increasing demand, was driven largely by the release of new device models by major manufacturers, thereby raising production levels significantly over the last fiscal year. The production of tablet devices, which also saw an increase in demand, similarly demonstrated considerably elevated levels over the previous fiscal year. Propped up by brisk sales in the United States, the production of automobiles in the market as a whole increased over the last fiscal year. Additionally, the market environment for industrial equipment also gradually improved over the previous fiscal year due to a recovery in capital expenditure for the likes of semiconductor manufacturing equipment and FA equipment.
Meanwhile, although last-minute demand prior to the consumption tax hike in Japan appeared to help push up demand for PCs slightly in that country, as a whole, PC production levels fell below those during the previous fiscal year under the impact of growth in the tablet device market. For hard disk drives (HDDs) as well, although there were signs of an increase in demand for HDDs for next-generation game consoles as well as HDDs for PCs spurred by the end of support for Windows XP, production levels for HDDs fell relative to the last fiscal year, during which special demand prompted by the large floods in Thailand was temporarily present.
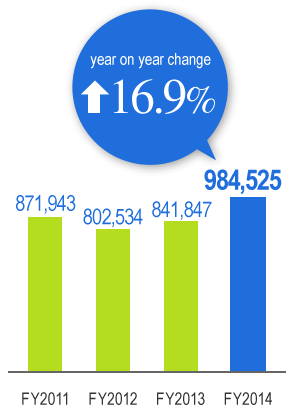
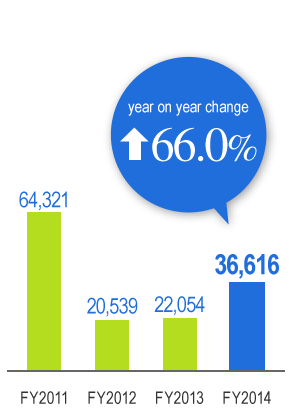
Amid such operating conditions, the consolidated business results of the TDK Group came to ¥984,525 million in net sales, a year-on-year increase of 16.9% over the ¥841,847 million in net sales reported for the previous fiscal year, and ¥36,616 million in operating income, a year-on-year increase of 66.0% over the ¥22,054 million in operating income reported for the previous fiscal year.
*FY2011: Fiscal year ended March 2011
Note: Operating results relating to the data tape business and Blu-ray business are separately presented as discontinued operations in consolidated statements of income for FY2014. Also reclassifications are made to consolidated statement of income for FY2012 and FY2013 to conform to the presentation used for FY2014.
Sales by Segment
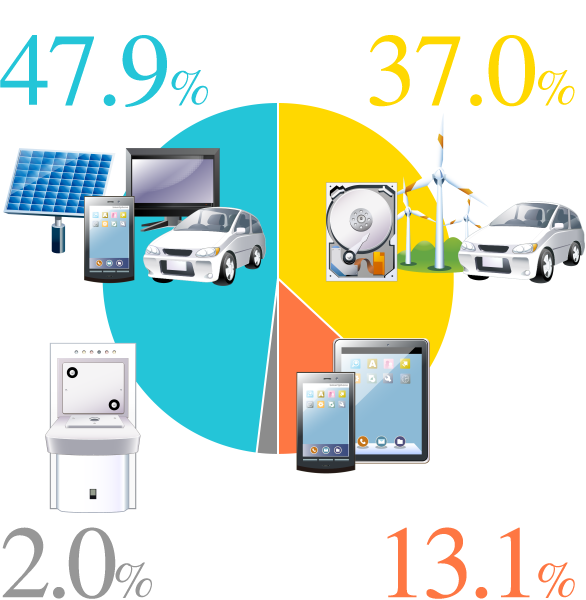
- Passive Components47.9%
- Magnetic Application Products37.0%
- Film Application Products13.1%
- Other2.0%


ProductsNet Sales(billions of yen)


*FY2013: Fiscal year ended March 2013
Financial Highlights
Years ended March 31 or as of March 31
(millions of yen)
| FY2004 | FY2005 | FY2006 | FY2007 | FY2008 | FY2009 | FY2010 | FY2011 | FY2012 | FY2013 | FY2014 | |
|---|---|---|---|---|---|---|---|---|---|---|---|
| Net Sales | 655,792 | 657,853 | 795,180 | 862,025 | 866,285 | 727,400 | 805,194 | 871,943 | 802,534 | 841,847 | 984,525 |
| (Overseas sales) | 487,169 | 473,828 | 621,522 | 690,673 | 714,172 | 610,944 | 703,190 | 763,046 | 691,962 | 736,015 | 890,520 |
| Cost of sales | 476,407 | 484,323 | 585,780 | 622,819 | 635,529 | 605,943 | 614,341 | 654,180 | 624,271 | 668,258 | 763,572 |
| Selling, general, and administrative expenses |
122,875 | 119,886 | 142,052 | 159,106 | 158,921 | 159,878 | 158,976 | 153,442 | 157,886 | 151,535 | 184,337 |
| Transfer to the government of the substitutional portion of the Employees' Pension Fund: |
|||||||||||
| Subsidy from the government |
(33,533) | ||||||||||
| Loss on settlement | 27,347 | ||||||||||
| Gain on sales of business to Imation Corp. |
(15,340) | ||||||||||
| Restructuring cost | — | — | 6,825 | 510 | — | 15,884 | 4,922 | — | — | — | — |
| Production realignment cost | 6,570 | — | — | ||||||||
| Realignment-related gain; Sale of properties |
(6,732) | — | — | ||||||||
| Operating income (loss) | 56,510 | 59,830 | 60,523 | 79,590 | 87,175 | (54,305) | 26,955 | 64,321 | 20,539 | 22,054 | 36,616 |
| Income (loss) before income taxes |
88,665 | 91,505 | (81,630) | ||||||||
| Income (loss) from continuing operations before income taxes |
55,847 | 60,728 | 66,103 | 23,088 | 60,620 | 14,668 | 19,765 | 39,772 | |||
| Income taxes | 12,133 | 23,284 | 21,057 | 16,985 | 19,948 | (17,041) | 9,401 | 15,105 | 11,970 | 14,616 | 17,936 |
| Income (loss) from continuing operations |
43,355 | 36,965 | 44,411 | 13,687 | 45,515 | 2,698 | 5,149 | 21,836 | |||
| Loss (income) from discontinued operations |
1,254 | 3,665 | 310 | (805) | (511) | (4,399) | (619) | (3,602) | |||
| Net income (loss) attributable to TDK |
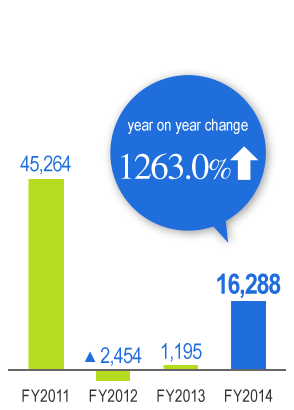
42,101 | 33,300 | 44,101 | 70,125 | 71,461 | (63,160) | 13,520 | 45,264 | (2,454) | 1,195 | 16,288 |
| FY2004 | FY2005 | FY2006 | FY2007 | FY2008 | FY2009 | FY2010 | FY2011 | FY2012 | FY2013 | FY2014 | |
|---|---|---|---|---|---|---|---|---|---|---|---|
| Per common share (Yen): | |||||||||||
| Net income (loss) attribute to TDK basic |
317.80 | 251.71 | 333.50 | 529.88 | 551.72 | (489.71) | 104.82 | 350.90 | (19.06) | 9.50 | 129.47 |
| Net income (loss) attributable to TDK diluted |
317.69 | 251.56 | 333.20 | 529.29 | 551.19 | (489.71) | 104.74 | 350.57 | (21.42) | 5.36 | 120.97 |
| Net cash flow | 700.46 | 650.47 | 775.50 | 1,022.45 | 1,101.11 | 204.75 | 750.77 | 948.98 | 589.91 | 623.37 | 787.06 |
| Net assets | 4,352 | 4,832 | 5,311 | 5,759 | 5,557 | 4,297 | 4,215 | 4,142 | 3,957 | 4,460 | 5,049 |
| Dividends per common share (Yen) |
55.00 | 70.00 | 90.00 | 110.00 | 130.00 | 130.00 | 60.00 | 80.00 | 80.00 | 70.00 | 70.00 |
| Payout ratio (%) | 17.3 | 27.8 | 27.0 | 20.8 | 23.4 | — | 57.2 | 22.8 | — | 736.8 | 54.1 |
| Total assets | 770,319 | 808,001 | 923,503 | 989,304 | 935,533 | 1,101,036 | 1,091,458 | 1,060,853 | 1,072,829 | 1,169,642 | 1,239,589 |
| Stockholders' equity | 576,219 | 639,067 | 702,419 | 762,712 | 716,577 | 554,218 | 543,756 | 534,273 | 498,159 | 561,169 | 635,327 |
| Working capital | 360,555 | 379,746 | 397,131 | 449,830 | 300,859 | 281,536 | 286,370 | 199,186 | 219,918 | 232,693 | 279,504 |
| Capital expenditures | 44,471 | 61,005 | 73,911 | 70,440 | 84,312 | 98,425 | 64,370 | 78,638 | 99,653 | 85,606 | 68,606 |
| Depreciation and amortization |
50,726 | 52,806 | 58,540 | 65,337 | 71,297 | 89,567 | 83,392 | 77,264 | 78,492 | 77,369 | 82,893 |
| Research and development |
32,948 | 36,348 | 45,528 | 50,058 | 57,387 | 57,645 | 53,874 | 52,608 | 51,968 | 53,520 | 63,385 |
| Ratio of overseas production to net sales (%) |
58.6 | 59.0 | 61.7 | 62.2 | 70.1 | 74.0 | 80.5 | 83.7 | 85.8 | 82.5 | 86.7 |
| Number of employees | 36,804 | 37,115 | 53,923 | 51,614 | 60,212 | 66,429 | 80,590 | 87,809 | 79,175 | 79,863 | 83,581 |