![]()
![]()
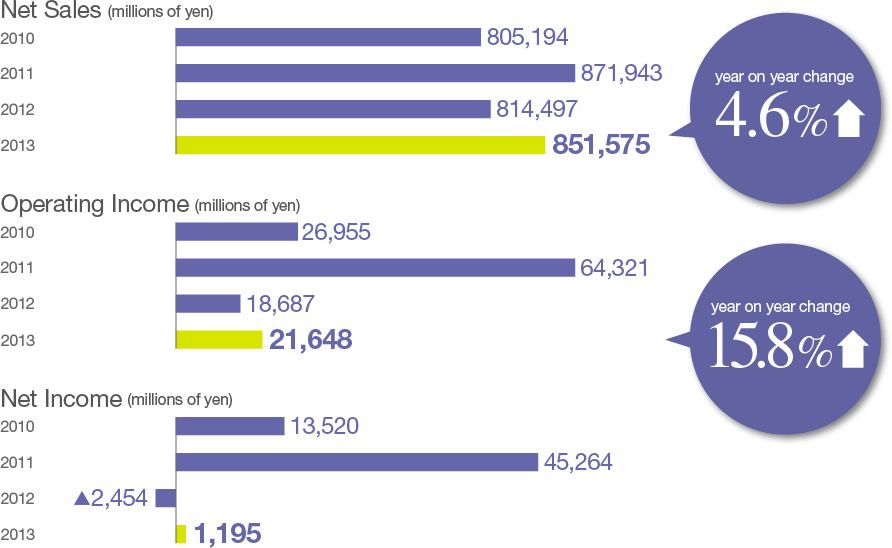
For the consolidated performance of TDK, net sales came to ¥851,575 million, an increase of 4.6% from the ¥814,497 million reported in fiscal 2012, and operating income was ¥21,648 million, a 15.8% increase from ¥18,687 million in fiscal 2012.
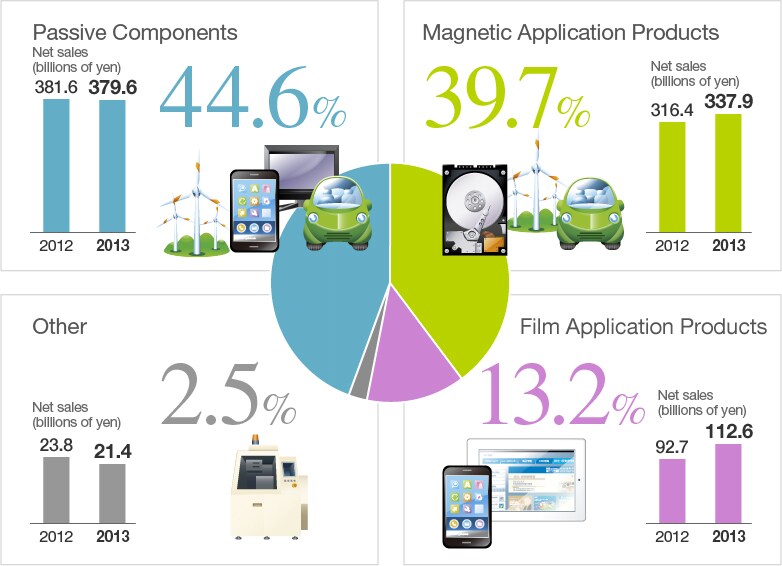
In mobile phones production, while that of conventional mobile phones declined, smartphone production grew, resulting in a slight rise over fiscal 2012 production levels for the total mobile phone market. Similarly, automobile production saw a marginal year-on-year increase for the market as a whole. This was due largely to the brisk sales performance of automobiles in the U.S., which offset the greater-than-expected sluggishness in the sales performance of hybrid cars and other visible declining factors. Meanwhile, in PC production, while that of tablet devices exceeded levels exhibited during fiscal 2012, notebook and desktop PC production fell below fiscal 2012 levels. Hard disk drive (HDD) production also fell below fiscal 2012 levels as a consequence of fluctuations in demand for PCs and certain other products.


(millions of yen)
Years ended March 31 or as of March 31
| 2003 | 2004 | 2005 | 2006 | 2007 | 2008 | 2009 | 2010 | 2011 | 2012 | 2013 | |
|---|---|---|---|---|---|---|---|---|---|---|---|
| Net sales | 604,865 | 655,792 | 657,853 | 795,180 | 862,025 | 866,285 | 727,400 | 805,194 | 871,943 | 814,497 | 851,575 |
| (Overseas sales) | 439,381 | 487,169 | 473,828 | 621,522 | 690,673 | 714,172 | 610,944 | 703,190 | 763,046 | 702,469 | 747,062 |
| Cost of sales | 459,552 | 476,407 | 484,323 | 585,780 | 622,819 | 635,529 | 605,943 | 614,341 | 654,180 | 634,257 | 676,079 |
| Selling, general, and administrative expenses | 115,569 | 122,875 | 119,886 | 142,052 | 159,106 | 158,921 | 159,878 | 158,976 | 153,442 | 161,715 | 152,287 |
| Transfer to the government of the substitutional portion of the Employees’ Pension Fund: | |||||||||||
| Subsidy from the government | (33,533) | ||||||||||
| Loss on settlement | 27,347 | ||||||||||
| Gain on sales of business to Imation Corp. | (15,340) | ||||||||||
| Restructuring cost | 5,197 | — | — | 6,825 | 510 | — | 15,884 | 4,922 | — | — | — |
| Production realignment cost | 6,570 | 1,561 | |||||||||
| Realignment-related gain; Sale of properties | (6,732) | — | |||||||||
| Operating income (loss) | 24,547 | 56,510 | 59,830 | 60,523 | 79,590 | 87,175 | (54,305) | 26,955 | 64,321 | 18,687 | 21,648 |
| Income (loss) before income taxes | 88,665 | 91,505 | (81,630) | ||||||||
| Income (loss) from continuing operations before income taxes | 20,552 | 55,847 | 60,728 | 66,103 | 23,088 | 60,620 | 12,245 | 18,858 | |||
| Income taxes | 6,193 | 12,133 | 23,284 | 21,057 | 16,985 | 19,948 | (17,041) | 9,401 | 15,105 | 11,486 | 14,328 |
| Income (loss) from continuing operations | 13,593 | 43,355 | 36,965 | 44,411 | 13,687 | 45,515 | 759 | 4,530 | |||
| Loss (income) from discontinued operations | 1,574 | 1,254 | 3,665 | 310 | (805) | (511) | (2,460) | — | |||
| Net income (loss) attributable to TDK | 12,019 | 42,101 | 33,300 | 44,101 | 70,125 | 71,461 | (63,160) | 13,520 | 45,264 | (2,454) | 1,195 |
| 2003 | 2004 | 2005 | 2006 | 2007 | 2008 | 2009 | 2010 | 2011 | 2012 | 2013 | |
|---|---|---|---|---|---|---|---|---|---|---|---|
| Per common share (Yen): | |||||||||||
| Net income (loss) attribute to TDK basic | 90.56 | 317.80 | 251.71 | 333.50 | 529.88 | 551.72 | (489.71) | 104.82 | 350.90 | (19.06) | 9.50 |
| Net income (loss) attributable to TDK diluted | 90.56 | 317.69 | 251.56 | 333.20 | 529.29 | 551.19 | (489.71) | 104.74 | 350.57 | (21.42) | 5.36 |
| Net cash flow | 521.05 | 700.46 | 650.47 | 775.50 | 1,022.45 | 1,101.11 | 204.75 | 750.77 | 948.98 | 600.96 | 627.89 |
| Net assets | 4,176 | 4,352 | 4,832 | 5,311 | 5,759 | 5,557 | 4,297 | 4,215 | 4,142 | 3,957 | 4,460 |
| Dividends per common share (Yen) | 50.00 | 55.00 | 70.00 | 90.00 | 110.00 | 130.00 | 130.00 | 60.00 | 80.00 | 80.00 | 70.00 |
| Payout ratio (%) | 55.2 | 17.3 | 27.8 | 27.0 | 20.8 | 23.4 | — | 57.2 | 22.8 | — | 736.8 |
| Total assets | 747,337 | 770,319 | 808,001 | 923,503 | 989,304 | 935,533 | 1,101,036 | 1,091,458 | 1,060,853 | 1,072,829 | 1,169,642 |
| Stockholders’ equity | 553,885 | 576,219 | 639,067 | 702,419 | 762,712 | 716,577 | 554,218 | 543,756 | 534,273 | 498,159 | 561,169 |
| Working capital | 315,948 | 360,555 | 379,746 | 397,131 | 449,830 | 300,859 | 281,536 | 286,370 | 199,186 | 219,918 | 232,693 |
| Capital expenditures | 41,026 | 44,471 | 61,005 | 73,911 | 70,440 | 84,312 | 98,425 | 64,370 | 78,638 | 99,653 | 85,606 |
| Depreciation and amortization | 57,132 | 50,726 | 52,806 | 58,540 | 65,337 | 71,297 | 89,567 | 83,392 | 77,264 | 79,918 | 77,938 |
| Research and development | 30,099 | 32,948 | 36,348 | 45,528 | 50,058 | 57,387 | 57,645 | 53,874 | 52,608 | 52,551 | 53,943 |
| Ratio of overseas production to net sales (%) | 55.8 | 58.6 | 59.0 | 61.7 | 62.2 | 70.1 | 74.0 | 80.5 | 83.7 | 80.2 | 81.8 |
| Number of employees | 31,705 | 36,804 | 37,115 | 53,923 | 51,614 | 60,212 | 66,429 | 80,590 | 87,809 | 79,175 | 79,863 |